
Power BI February Update
According to the Microsoft Power BI website there are two major themes for the Power BI February update. The first theme is a focus on some of the 'major asks' they have been requested to improve in the program. These include multi-selecting data points across multiple charts and syncing slicer values across multiple pages of your report. There has also been a major update to the SAP HANA connector. The second theme is a focus on performance improvements. See below for two of our favorite updates plus a list of all the February updates.
Multi-select data points across multiple charts
Multi-selecting data points across multiple charts was one of the most highly asked for features that has now come to fruition. You can now ctrl + click on data points in multiple charts and have the cross filters applied to your entire report. As you select data points across multiple charts, they will apply both those filters together.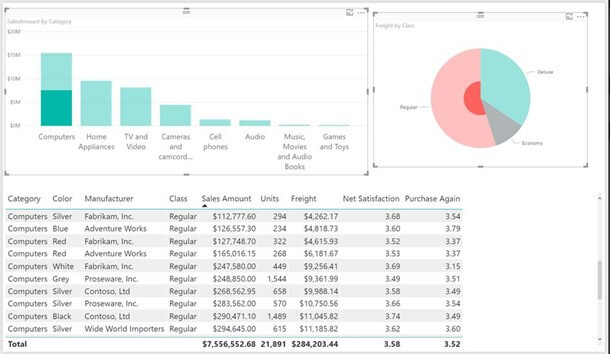
Sync slicers across multiple pages of your report
Another feature that was highly sought after was to have slicers that apply to multiple pages. To meet this request, Microsoft have added a “sync slicers” pane that will let you select slicers to stay in sync across multiple pages. For instance, selecting “red” on a product color slicer on page 1 will be reflected in the product color slicer on page 2 if the two pages are synced. You can reach the sync slicers pane from the View tab.
Once you’ve opened the pane, select a slicer to see the options. You can quickly make the slicer apply to every page by clicking the ‘Add to all’ link. A hidden slicer will be put on every page, synced to the currently selected slicer. You can also use the right column to pick if the slicer is visible on each page or not.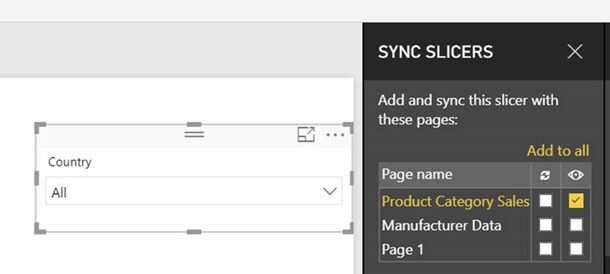
To get the scoop on all the updates see the list below:
Reporting
- Multi-select data points across multiple charts
- Sync slicers across multiple pages of your report
- Numeric range slicer improvement – whole number snapping (preview)
- Faster geocoding for Bing maps (web preview)
- Overflow data labels for bar and column charts
- Search the formatting and analytics pane
Analytics
- Mark custom date table
- Quick measures are now generally available
- UTCNOW () and UTCTODAY ()
Custom visuals
- Organizational custom visuals (preview)
- Network Visualization and Filter
- Slope chart by MAQ Software
- Filter by List
- As Timeline
- As T- Accounts
Data connectivity
- Improvements to DirectQuery over SAP HANA (preview)
Other
- DirectQuery performance improvements
- Open and save performance improvements
- “Show items with no data” improvements
- Persistent filters control for upcoming Power BI service feature
- Consulting Services quick link
To learn more about Power BI and Business Intelligence, come join us at one of our highly reviewed courses.