Apply Functions in R
In R, functions from the apply family are used to apply a function repeatedly to subsets of data in a single line of short code. They are great for reporting summary statistics for each row or column of data or even for different categories within the dataset.
We refer to the apply family because there are a few different apply functions, each operating in a slightly different way. These functions are also known as functionals because they take other functions as arguments. These functions are applied to subsets of the data.
Functionals can often be used in place of writing loops. The code for an apply function is much more concise than code for a loop, which can save time spent on writing, debugging and maintaining code. Apply functions can also be faster than loops in R. But remember, where possible, take advantage of vectorisation in R! It is always the fastest option.
The examples below demonstrate the use of apply functions using the mtcars dataset, distributed with R.
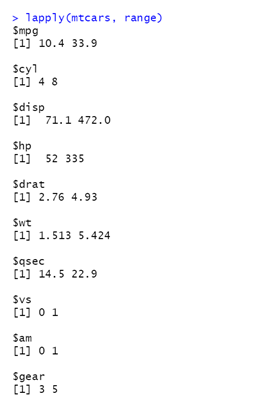
Need to calculate the range of each column in a dataframe?
lapply() will return the range (minimum and maximum value) for each column as a list. Each element of the list will have the same name as the column name.

sapply() will return the same data in a simplified format, i.e. a matrix.

Want to compare average values between categories?
The tapply() function allows you to split a vector of values by a factor (category) and then applies a function to each category subset.

In the example above, the results show the average miles per gallon achieved by cars with 4, 6 and 8 cylinders.
Working with multiple datasets?
The mapply() function is the multivariate apply function and allows you to specify multiple datasets. The function will first be applied to each element of each dataset, then to the next element of each and so on.
For example, we can use the beaver1 and beaver2 datasets distributed with R. Both are structured identically and contain body temperature measurements recorded at regular intervals.
mapply() can be used to return the range of values for each column in the combined datasets.
Learn more about R Programming on our courses or by enrolling in our R certification programme. For beginners, we recommend the R Basics course.
R Programming Courses


