The Report That Takes Three Days Every Month
Somebody in your organisation spends the first week of every month rebuilding a report they already built last month. They are good at it, which is part of the problem. Here is what is actually happening, and the tool that fixes it that you already own.
01
You will recognise this
On the first working day of the month, someone exports a file from the finance system. Then another from the CRM. Then a third that a colleague emails over, formatted slightly differently from last time because they changed a column heading.
What follows is two or three days of the same work as last month. Delete the top four rows of junk. Split the date column because it imported as text. Find and replace the seven ways people spell the same client name. Copy a lookup down 40,000 rows. Reformat, sanity check, hunt for the total that does not match, fix it, send.
Nobody has done anything wrong here. Every one of those steps is a reasonable response to messy data. The problem is that they are being done by a person, from memory, every single time.
The tell
If the answer to "how long would it take to run this report again with updated numbers?" is measured in days rather than minutes, the process is the problem, not the data.
02
What it actually costs
Three days a month is around seven working weeks a year, from one person, on one report. Most organisations have more than one of these. But the hours are the least interesting part of the bill.
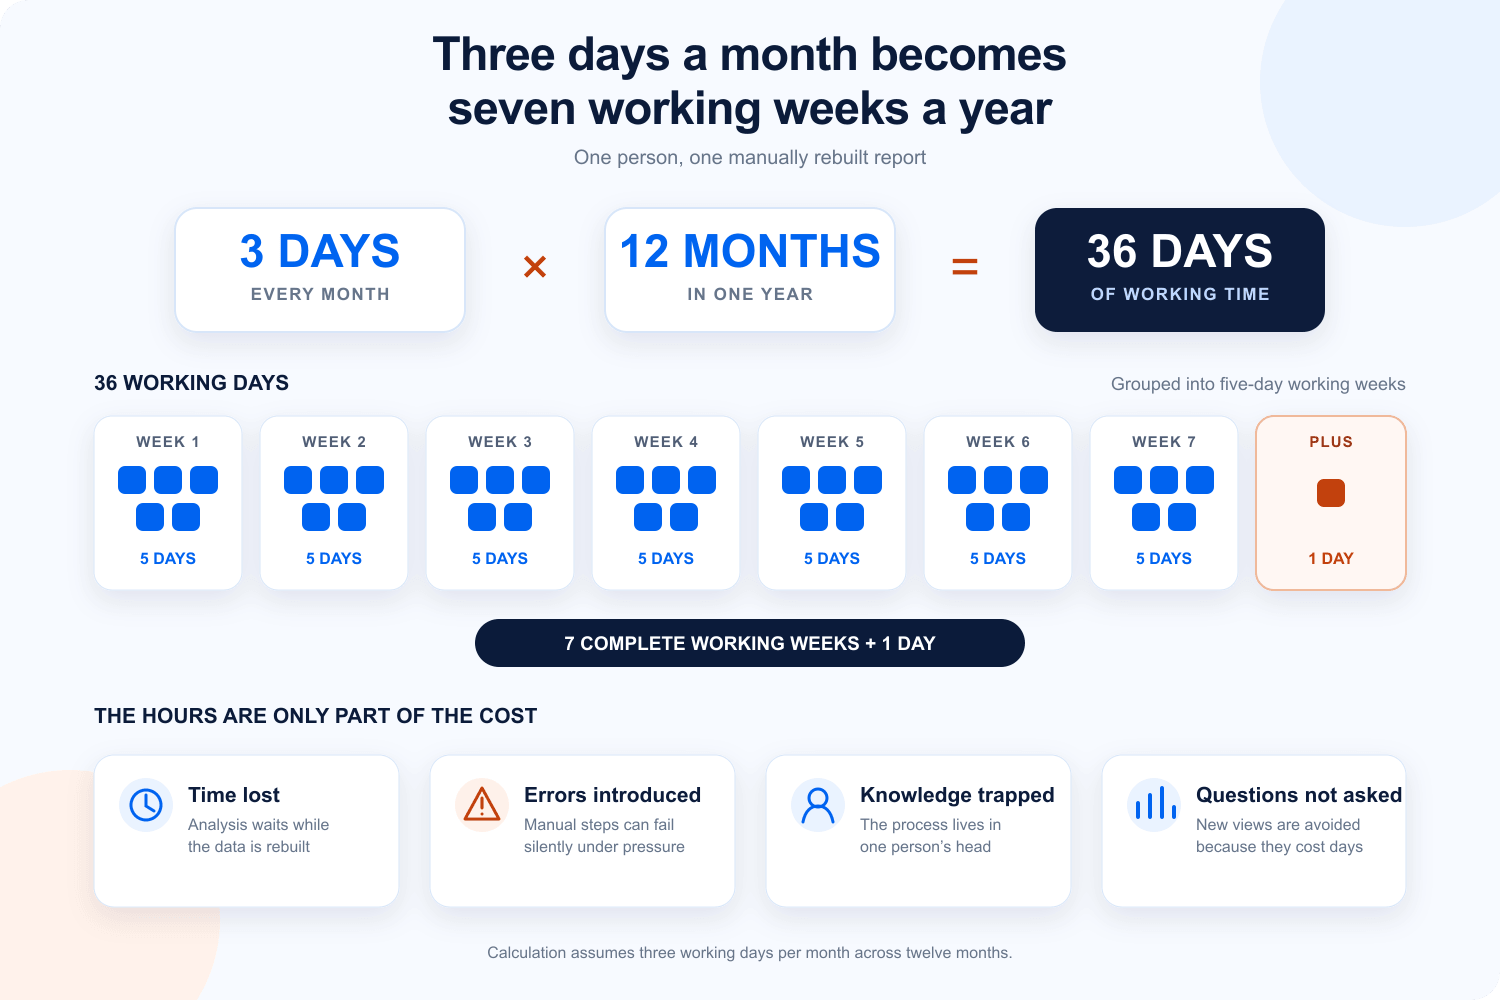
- The errors you find are not the problem. Manual steps done under time pressure produce mistakes, and the ones you catch cost you an afternoon. The ones you do not catch go into a board pack.
- It cannot be checked. A colleague cannot review a process that only exists as a sequence of things someone remembers doing. There is no version history of a train of thought.
- It cannot be handed over. When that person is on leave, the report is late. When they resign, it is rebuilt from scratch by someone who does not know why the fourth row gets deleted.
- It blocks the actual question. Nobody asks "can we see that split by region?" when the answer is another three days. The report stops being a tool and becomes a ritual.
That last one is the expensive one, and it never appears on any timesheet.
03
What actually fixes it
Power Query. It sits inside Excel under Data, then Get Data, and inside Power BI Desktop as the Transform Data window. Most people who use Excel every day have never opened it.
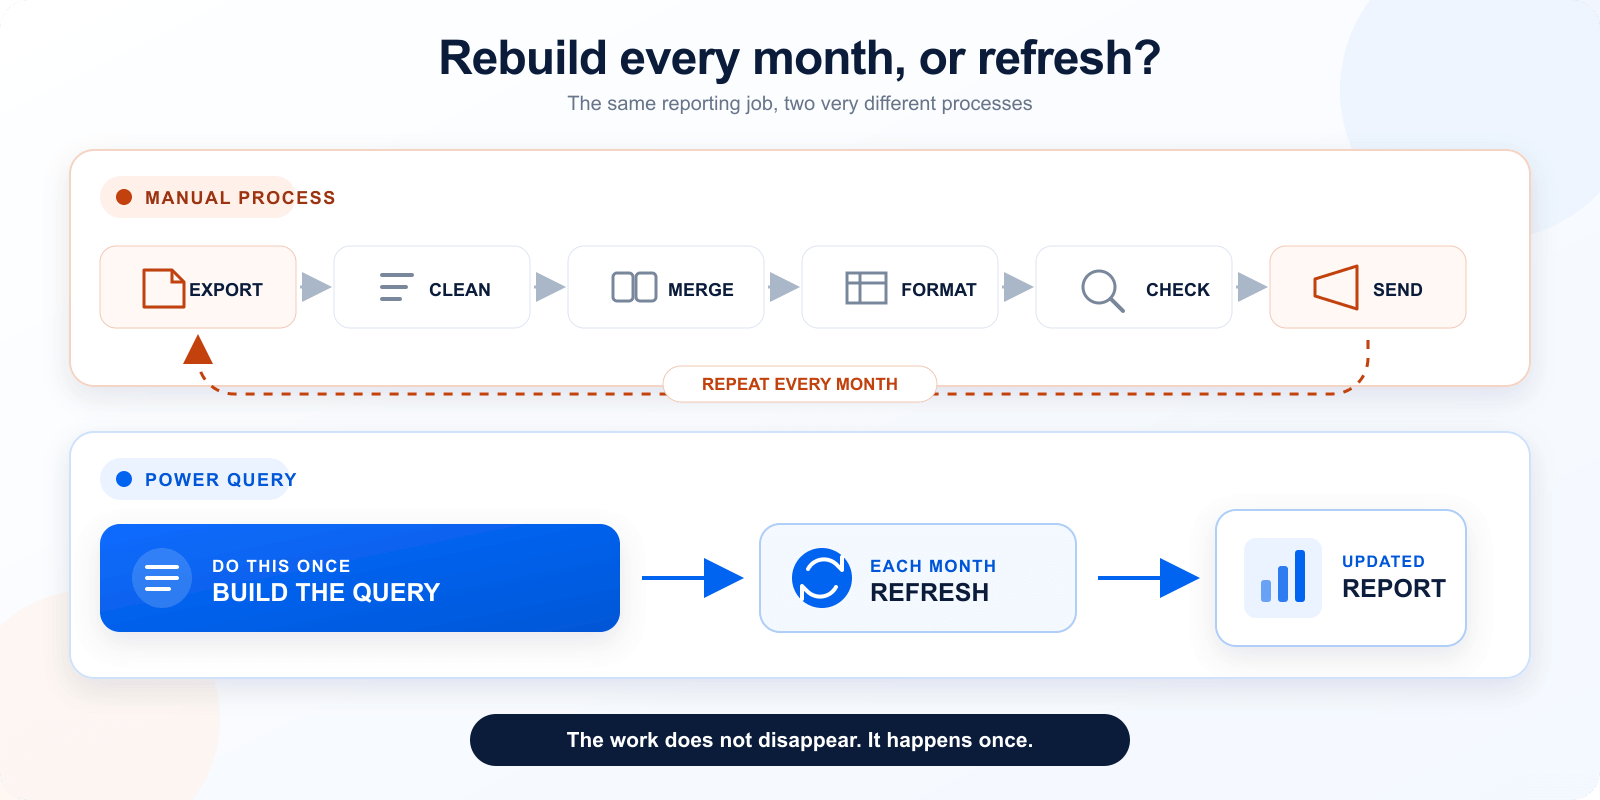
What it does is simple enough to describe in a sentence: it records the cleaning steps you take, in order, and replays them against new data whenever you ask. You do the work once. After that it is a button.
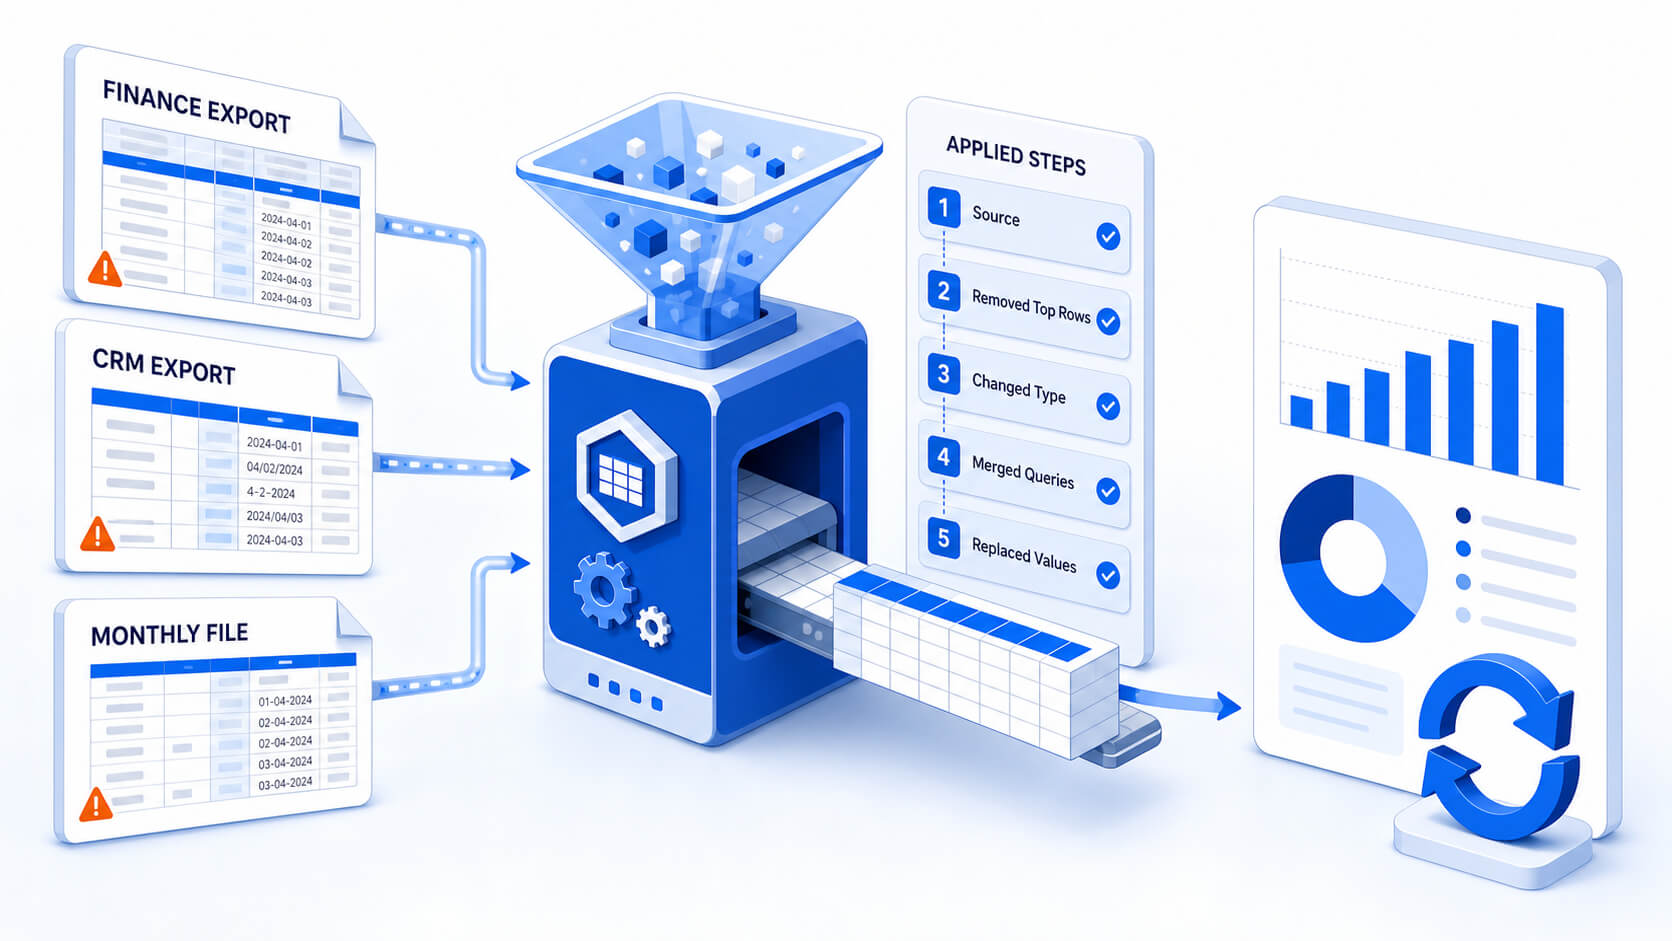
The steps are listed down the right hand side of the window as you make them. You can rename them, reorder them, delete one from the middle, or click on step four to see exactly what the data looked like at that moment. That list is the documentation you never wrote.
You are already paying for it
Power Query is not an add-on or an upgrade. It has shipped inside Excel for Windows since 2016 and it is the data layer of Power BI Desktop, which is free to download. Excel for Mac supports a growing subset. There is no procurement conversation to have here, which removes the usual reason these projects stall.
04
The five jobs people do by hand that it does for you
| The manual version | What it is called in Power Query |
|---|---|
| Deleting the junk rows at the top of every export | Remove Top Rows, applied automatically on every refresh |
| Copying one file's data under another's | Append, or point it at a whole folder and let it read every file in there |
| A lookup formula dragged down 40,000 rows | Merge, which is the same idea without the recalculation |
| Rearranging a cross tab into a list so you can pivot it | Unpivot, which is one right click and is the step that saves the most time |
| Find and replace on the seven spellings of one client name | A mapping table you maintain once, merged in |
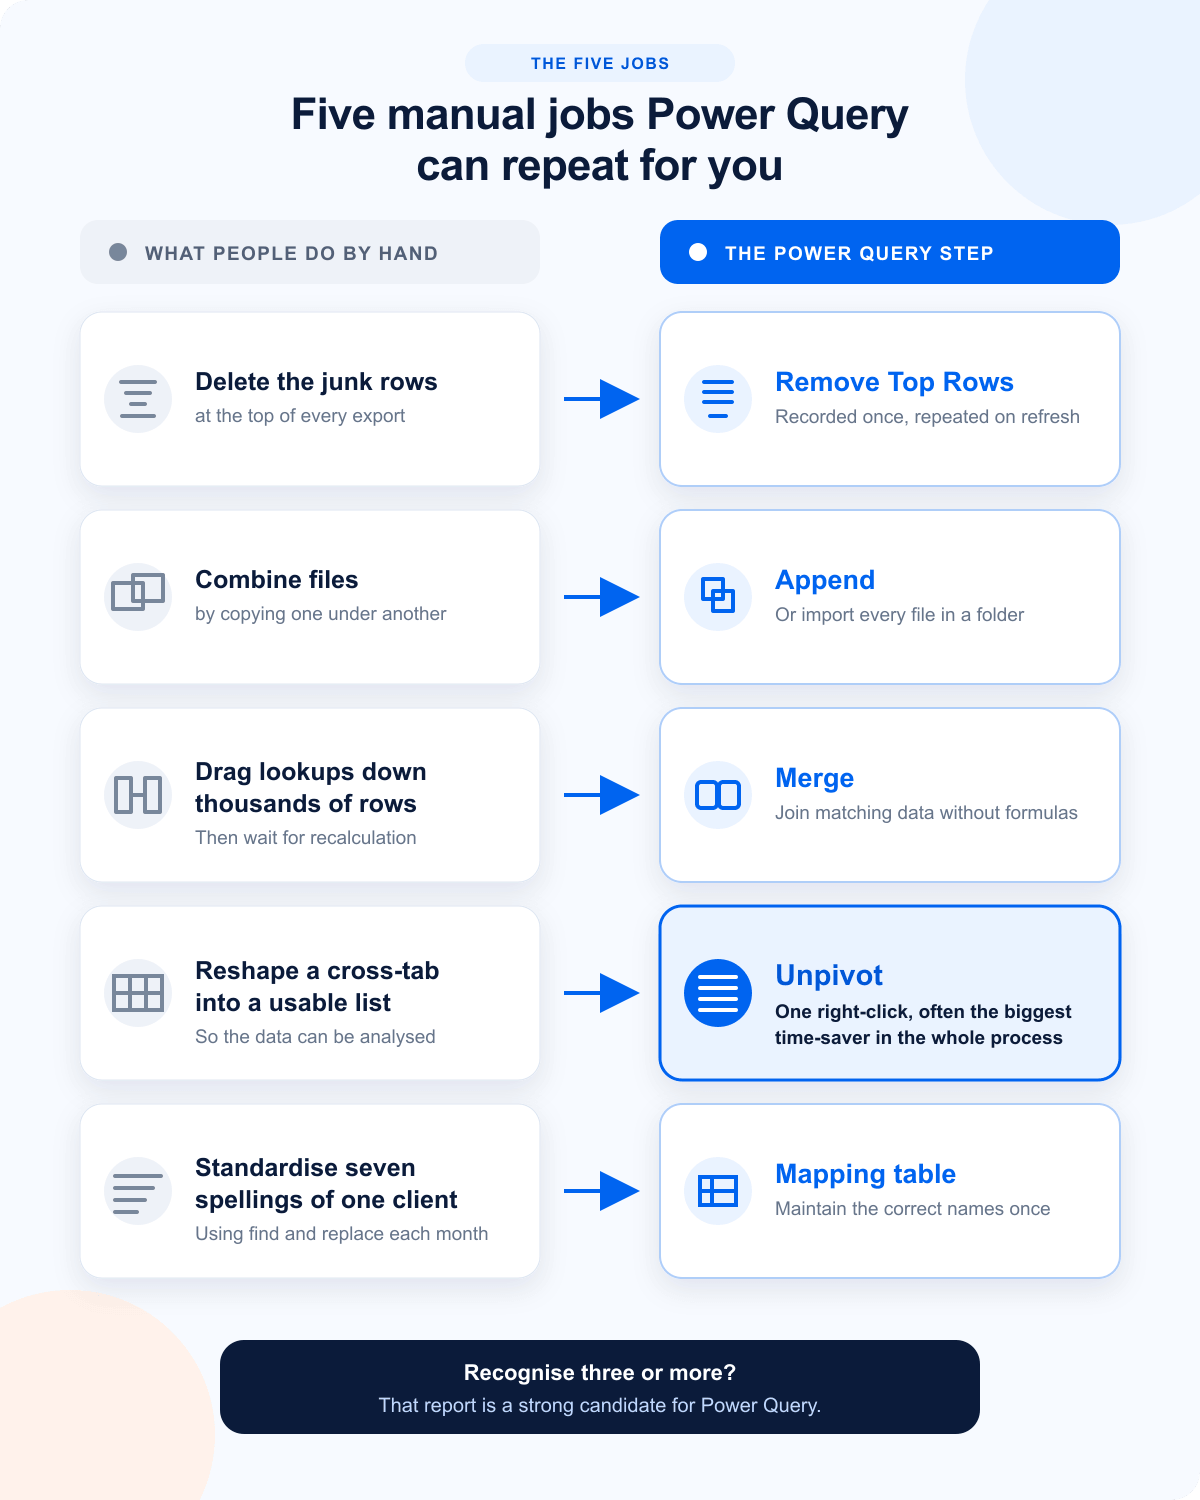
If you recognise three or more of the left hand column, the report you are thinking of is a candidate. If you recognise all five, it is not a candidate, it is overdue.
05
What it honestly takes to learn
We are not going to tell you this is effortless. Here is the real shape of it.
- An afternoon gets you importing, removing rows and columns, splitting and changing data types, and hitting refresh. That alone kills a surprising amount of the three days.
- One day gets you merge, append, unpivot, folder imports and parameters, which is where the process becomes genuinely repeatable rather than just faster.
- Beyond that is custom columns and the M language, which most people never need. It is worth knowing it exists so you do not assume you have hit the ceiling when you have not.
The thing that catches people is not difficulty. It is that Power Query asks you to think about data as a pipeline rather than as a page you are editing. That is a genuine shift, and it is much faster with someone in the room than alone with a search engine at 5pm.
Data Transformation using Power Query Editor, Power BI Desktop is one day and covers exactly the list above. If your reporting is still entirely inside Excel, Excel Intermediate and Advanced reach the same tools from the direction you already know.
Try this in ten minutes
Prove it on one file, today
Take one of the exports you clean every month. Make a copy so you cannot break anything.
- In a blank Excel workbook, go to Data, Get Data, From File, and pick your copy.
- Choose Transform Data rather than Load. This is the whole point, and it is the button everyone skips.
- Do the two or three things you always do. Remove the junk rows. Delete the columns nobody reads. Set the date column to a date type.
- Watch the Applied Steps list building on the right as you go.
- Click Close and Load.
- Now overwrite your copy with next month's export, keeping the same file name, and press Refresh All.
Step six is the one that changes how people think about their month end. Everything you did in step three happens again, in order, in about a second.
Build the capability
Related Nexacu courses
Instructor led, one day, face to face across Australia or live online.
Data Transformation using Power Query Editor, Power BI Desktop
1 day | $622
The direct answer to this article. Import, shape, merge, append, unpivot, parameters and refresh.
Power BI Beginner
1 day | $395
If the report also needs to be seen by people who will never open a spreadsheet.
Excel Intermediate and Advanced
1 day each
The same tools reached from inside Excel, if that is where the report has to live.
Whole team on the same report? Corporate training can be run on your own file, which is considerably more persuasive than a sample dataset.
Common questions
Frequently asked questions
Do this next
Run the ten minute exercise on one file. If step six works, you have found seven weeks a year and removed a single point of failure from your month end. That is the whole business case, and you can test it before lunch.