Recent Searches
Category

Microsoft Power BI

Category

Microsoft Excel

Category

Microsoft Copilot Courses

Category

SharePoint

Category

Professional Development

Category

Microsoft Project

Category

Power Automate

Category

Power Apps

Category

AI for Business

Category

SQL

Category

Microsoft 365

Category

Microsoft Word

Category

Python

Category

Microsoft Teams

Category

Excel Specialist

Category

Microsoft PowerPoint

Category

Microsoft Outlook

Category

R Programming

Category

Microsoft Access

Category

Microsoft Visio

Category

HTML Courses

Category

WordPress

Category

Microsoft Windows 11 Courses

Category

Adobe InDesign Courses

Category

Adobe Premiere Pro Training

Category

Adobe After Effects Training

Category

Adobe Photoshop Courses

Category

Adobe Illustrator Courses

Category

Canva Courses

Category

Articulate

Category

Adobe Acrobat Courses

Category

Adobe Animate Training

Category

Adobe Captivate Training

Course

Power BI Beginner

Course

Excel Beginner

Course

Copilot for M365

Course

SharePoint Beginner

Course

Achieving Leadership & Success

Course

Project Beginner

Course

Power Apps Beginner

Course

SQL Beginner

Course

Word Beginner

Course

Word Advanced

Course

Word Intermediate

Course

Python Beginner

Course

Teams Essentials

Course

Financial Modelling

Course

PowerPoint Level 1

Course

Microsoft Outlook Beginner to Intermediate

Course

R Programming Beginner

Course

Microsoft Access Essentials

Course

Visio Essentials

Course

HTML Training Intro

Course

Windows 11 End User Course

Course

InDesign Lite

Course

Premiere Training Intro

Course

After Effects Training Intro

Course

Photoshop Lite

Course

Illustrator Training Intro

Course

Articulate Storyline 360 Essentials

Course

Acrobat Essentials

Course

Animate Training Intro

Course

Captivate Training

Course

Power BI Intermediate

Course

Excel Intermediate

Course

Copilot for Word

Course

SharePoint Intermediate

Course

Anger Management & Negotiation Skills

Course

Project Intermediate

Course

Power Apps Intermediate

Course

ChatGPT Beginner

Course

SQL Intermediate

Course

Python Intermediate

Course

Analysis and Dashboards

Course

PowerPoint Level 2

Course

R Programming Intermediate

Course

InDesign Training Intro

Course

Photoshop Training Intro

Course

Articulate Storyline 3 & 360 Advanced

Course

Acrobat Forms

Course

Power BI Advanced

Course

Excel Advanced

Course

Copilot for Excel

Course

SharePoint Advanced (Site Owner)

Course

Assertiveness & Confidence

Course

Project Advanced

Course

Power Apps Intermediate | Power Automate + Power BI Integration

Course

AI Prompting Fundamentals

Course

Python Advanced

Course

Excel VBA

Course

R Programming Advanced

Course

Microsoft Access Advanced

Course

InDesign Training Advanced

Course

Canva Beginners

Course

Power BI DAX

Course

Excel Expert

Course

Copilot for PowerPoint

Course

SharePoint Advanced (Document Governance)

Course

Building Resilience

Course

Power Apps Advanced

Course

Machine Learning in R

Course

Canva Intermediate

Course

Copilot for Outlook and Teams

Course

Coaching and Mentoring

Course

Canva Advanced

Course

Communications

Course

WordPress Essentials

Course

Premiere Basics Training

Course

Advanced After Effects Training

Course

Illustrator Training Advanced

Course

Canva AI

Course

Microsoft Copilot Agent Builder

Course

Communications & Quality Client Service Training

Course

AI for Business Leaders and Managers

Course

Advanced Premiere Training

Course

Photoshop Training Advanced

Course

Power BI Copilot Training

Course

Critical Thinking and Problem Solving

Course

AI Governance Training

Course

InDesign Interactivity Training

Course

Copilot for Customer Service

Course

Cultural Diversity in the Workplace

Course

Claude AI Course

Course

InDesign Accessibility Training

Course

Copilot for Executives and Managers

Course

Embracing Change

Course

Microsoft Outlook Advanced

Course

Copilot for Finance

Course

Growing Emotional Intelligence

Course

SQL Advanced

Course

Copilot for HR

Course

Minute Taking

Course

Planner Premium

Course

Excel Tables and Pivot Tables

Course

Copilot for Legal Services

Course

Power Automate Beginner

Course

Microsoft 365 Essentials

Course

Data Transformation with Power Query

Course

Excel Macro Mastery

Course

Copilot for Marketing

Course

Persuasion and Negotiation Skills

Course

Power Automate Intermediate

Course

Power BI Desktop Advanced Reporting

Course

Copilot for Operations

Course

Presentation Skills and Public Speaking

Course

Data Visualisation with Power BI Desktop

Course

Copilot for Sales

Course

Practical Project Management

Course

Respect, Equity and Diversity (RED)

Course

Resumé Writing and Interview Skills

Course

Stress Management

Course

Team Leadership, Management and Development

Course

Time Management Intensive

Course

Train the Trainer

Course

Write Effective Business Documents

Course

Dealing with Difficult People

Course

Managing Difficult Conversations

Course

Managing the Virtual Workplace

Course

Customer Service Training

Course

Technical Writing

When Power BI Reports Disagree: Two People, Two Numbers, One Meeting

Nexacu | Aug 27
The Workaround • No. 3 • Power BI

When Power BI Reports Disagree: Two People, Two Numbers, One Meeting

Finance says revenue was 2.4. Sales says 2.6. Both pulled from the same system, both are confident, and the next twenty minutes are spent on arithmetic instead of the decision. This is not a data problem. Here is what it actually is.

Explore Power BI trainingNexacu • 10 September 2026 • 6 minute read
BI
Quick answer

The short version

  • The numbers disagree because each team built its own copy, and every copy carries its own quiet decisions about dates, exclusions and what counts.
  • A prettier dashboard does not fix this. A shared model does, because the definition of the metric lives in one place instead of four.
  • The technical name for the fix is a semantic model with measures. The organisational name for it is deciding who owns the definition.
  • There is a ten minute exercise that will tell you how bad your version of this is, and it does not involve opening Power BI.

01

You will recognise this

Somebody puts a slide up. Somebody else says "that is not the number I have." The room goes quiet in the particular way it does when everyone privately suspects their own figure might be the wrong one.

What follows is never a resolution. It is an action item: two people will take it offline and reconcile. They will spend a day on it. They will find the cause, quietly agree a fudge, and it will happen again next quarter with a different metric.

Nobody built a wrong report. Each one is internally consistent and defensible. They just answer slightly different questions while using identical words.

The tell

If your organisation has a person whose informal job is to explain why two reports disagree, you have found the workaround. That person is a control, and they are the only one you have.

02

Where the difference actually comes from

In almost every case it is one of five things, and none of them are errors.

The quiet decision What one person assumed and the other did not
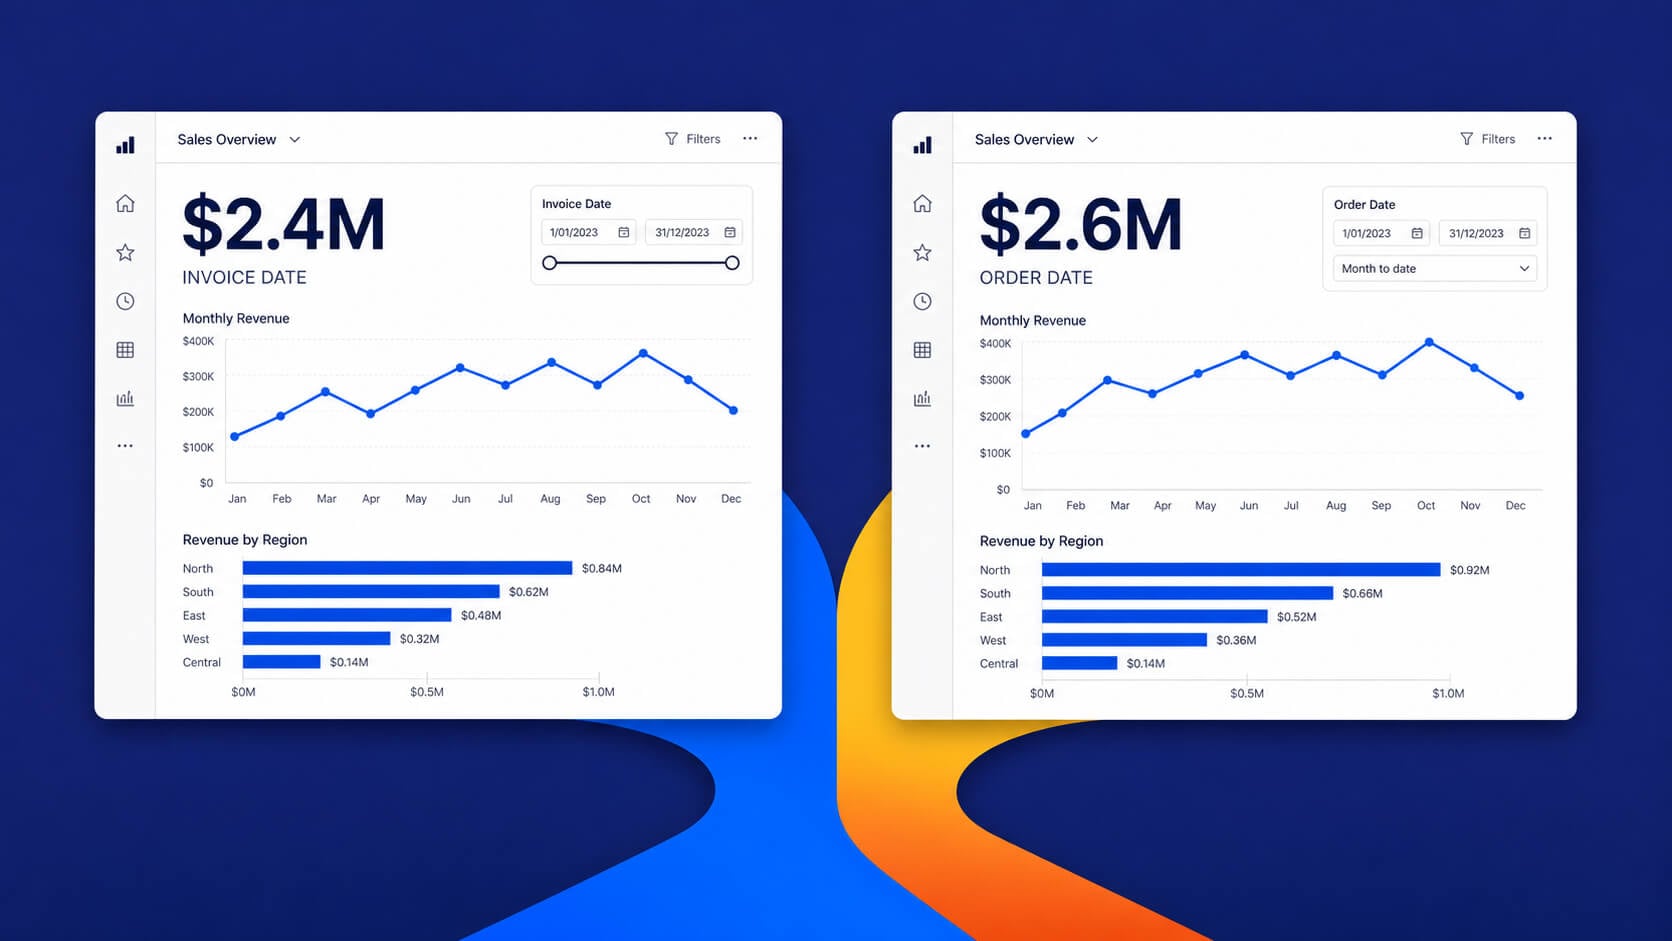
Which date Order date, invoice date, payment date or delivery date. All defensible, all different months.
What is excluded Cancellations, internal transactions, test accounts, GST, freight, the one client everyone treats as a special case.
When it was pulled Tuesday's extract against Thursday's. Late entries and credits landed in between.
Which grain One counts orders, the other counts order lines. The same data, counted at two different levels.
Whose hierarchy Region by customer address or by account manager. Reorganisations make both true and neither comparable.
Two Power BI reports using invoice date and order date show revenue totals of $2.4 million and $2.6 million.

Notice that not one of these is fixed by better visualisation. They are all decisions made silently at the moment somebody built their own copy of the data.

03

What actually fixes it

One model, used by everybody, where the definition is written down once as a measure rather than re-derived by each person who needs the number.
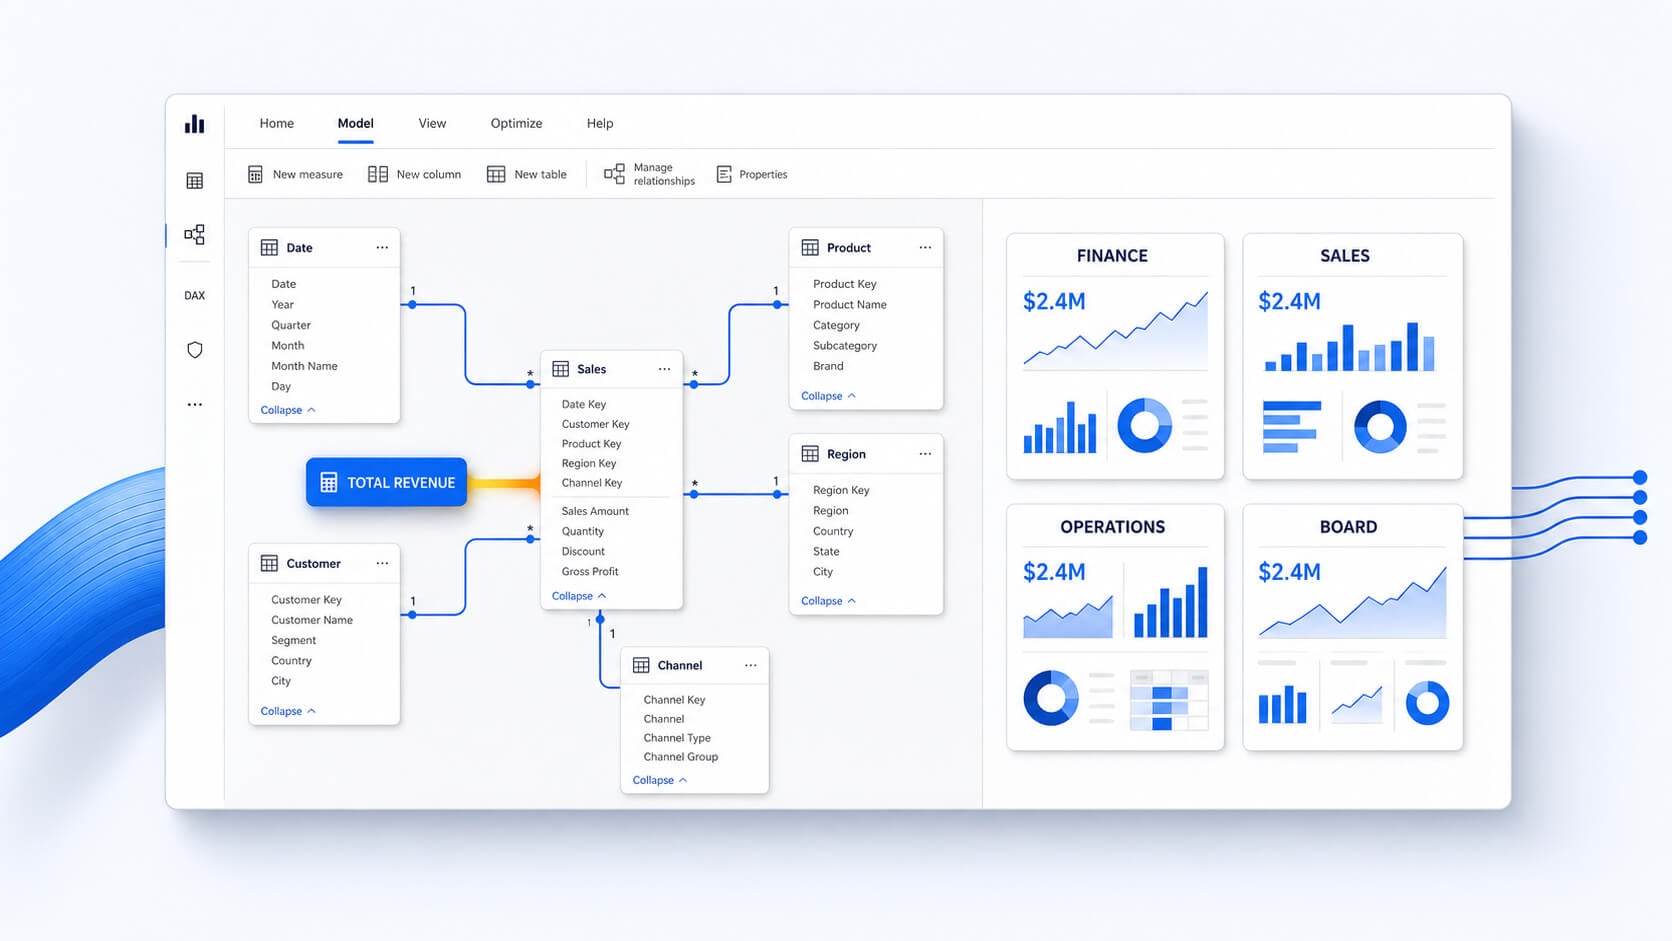
A shared Power BI semantic model applies one Total Revenue measure across finance, sales, operations and board reports.

In Power BI this is the difference between a calculated column and a measure, and it is the single concept that separates people who fight with Power BI from people who find it obvious.

A column computes a value for every row, once, when the data refreshes. A measure computes when somebody looks, using whatever filters they have applied. Write Total Revenue as a measure and it is correct by month, by region, by salesperson and in total, because it is one definition being evaluated in different contexts rather than five definitions that happen to agree.

That is what stops the disagreement. Finance and sales can slice it differently. They cannot calculate it differently.

The part people skip, and should not

A shared model needs a proper date table, marked as the date table, with one row per day covering your whole range. Almost every "the totals do not match by month" problem traces back to its absence. It takes ten minutes to add and it prevents an entire genre of argument.

04

The half nobody wants to do

Here is the uncomfortable part. Building the model is the easy half. The hard half is that somebody has to decide which definition wins, and that is not a technical decision.

When finance and sales have used different revenue definitions for six years, choosing one means somebody's historical numbers change. That conversation is genuinely awkward and it is why so many organisations quietly prefer four dashboards to one.

What makes it manageable is doing it in the right order:

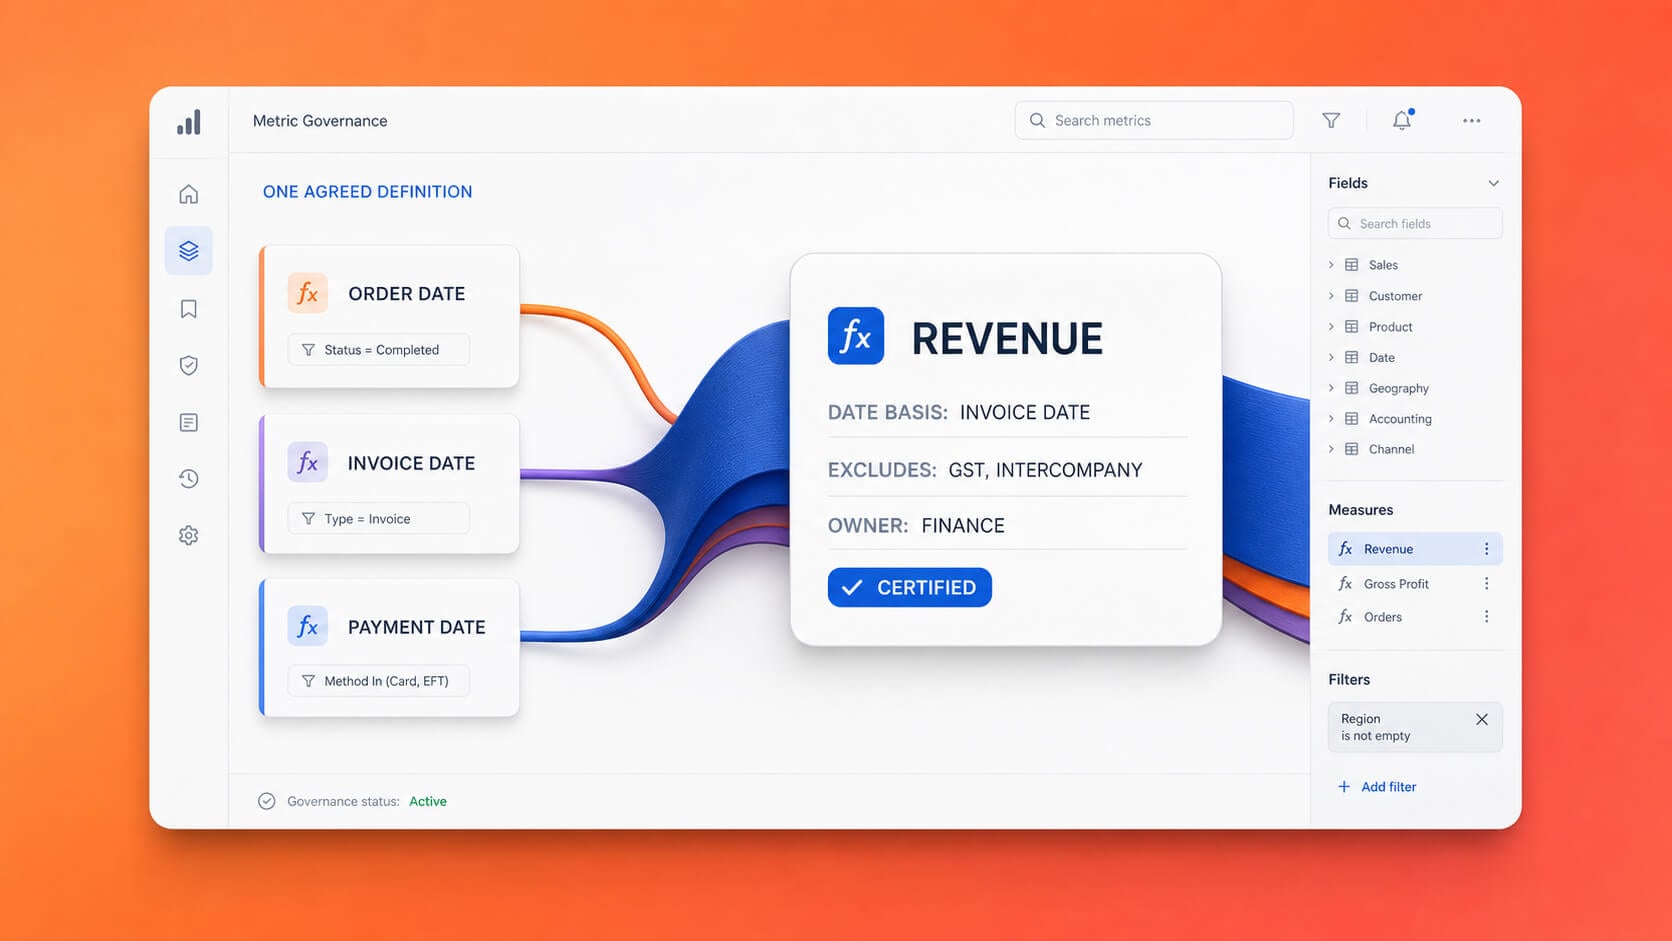
  1. Write the definitions down before you build anything. One line each, in words, agreed by the people who use them. "Revenue is invoiced amount excluding GST, on invoice date, excluding intercompany."
  2. Accept that some metrics need two. Sales pipeline revenue and recognised revenue are genuinely different things. Give them different names and stop pretending they should reconcile.
  3. Name an owner per metric. Not a committee. One person who decides when the definition changes.
  4. Then build it once, publish it to a shared workspace, and have every report connect to that model rather than importing its own copy.

Power BI supports this with shared semantic models and endorsement, so a model can be marked as promoted or certified and users can see which one is the real one. That feature is worth nothing until step one is done.

05

What it honestly takes to learn

  • One day to load data, build relationships and produce a report people can use. This is a genuinely fast start and it surprises people.
  • A second day for the model itself: star schema, a real date table, measures instead of columns, and why a flat table imported from Excel causes most beginner problems.
  • A third for DAX, where filter context stops being mysterious. Most people hit this wall about three weeks in, when a total is right and the subtotals are not.

The honest warning: Power BI lets you build something that looks finished on day one and is structurally wrong. Nothing tells you. It works until the day someone asks a question you did not anticipate, and then it quietly gives the wrong answer. That is the specific failure a course prevents and self teaching usually does not.

Power BI Beginner gets you producing. Power BI Intermediate is where the modelling lives, and it is the one that fixes the problem in this article. Power BI DAX is for when the subtotals stop behaving.

Try this in ten minutes

The definition audit

You do not need to open Power BI for this, and it is more revealing than anything you could build.

  1. Pick the metric that appears in the most meetings. Revenue, utilisation, active customers, whatever yours is.
  2. Message three people who use it, separately, so they cannot see each other's answers.
  3. Ask exactly this: "In one sentence, how is this calculated? Which date does it use, and what is excluded?"
  4. Put the three replies side by side.
Three revenue definitions being reconciled into one certified metric owned by finance.

If they match, you are in better shape than most and this article is not urgent. If they do not, you have just found the cause of every reconciliation meeting for the last two years, and you have it in writing, which is exactly what you need to get the fix funded.

Build the capability

Related Nexacu courses

Instructor led, one day each, face to face across Australia or live online.

Power BI Intermediate

1 day | $595

Relationships, star schema, date tables and measures. The direct answer to this article.

Power BI Beginner

1 day | $395

Start here if nobody in the team has built a report yet.

Power BI DAX

1 day | $595

Filter context, time intelligence, and why the total is right when the subtotals are not.

If the disagreement spans several teams, corporate training run on your own model gets everyone to the same definition in the same room, which is usually the actual bottleneck.

Common questions

Frequently asked questions

What is the difference between a measure and a calculated column?

A calculated column is worked out for every row when the data refreshes, and stored. A measure is worked out when somebody looks at it, using whatever filters are applied at that moment. Totals, ratios and percentages should almost always be measures. If you have built a column that sums or averages, that is usually the thing making your subtotals misbehave.

Do we need Power BI, or can we do this in Excel?

Excel can hold a data model with relationships and measures, so the concepts are identical and worth learning either way. The reason to move to Power BI is distribution: one published model that many reports connect to, with a record of who is using which version. In Excel, sharing a model still means sending someone a file, and a file that has been sent is a copy, which is the problem you started with.

Our data is messy. Should we fix that before building a model?

Not entirely, or you will never start. Clean it inside Power Query as part of the load, which means the cleaning is repeatable and visible rather than a set of manual fixes somebody applies each month. What you should settle before building is the definitions, not the data quality. Messy data produces a number that is roughly wrong. Ambiguous definitions produce four numbers that are each precisely wrong.

How do we stop people building their own version anyway?

Mostly by making the shared one better than the alternative rather than by prohibiting anything. People build their own copy because the official one does not answer their question, or they cannot get access to it quickly. Endorsement helps people find the right model, and access that takes a day rather than a fortnight removes most of the motive. A rule against it, with no usable alternative, just moves the copies somewhere you cannot see them.

Do this next

Run the definition audit on your most argued about metric. It takes ten minutes, it costs nothing, and the three replies sitting side by side make the case for the fix better than any business case you could write.

The Workaround is a fortnightly series on the manual processes organisations build because nobody showed them the feature. Previously: two files open side by side. Next: one person knows how the model works, and what happens when they resign.

Trusted Nationwide by Leading Organisations

at Nexacu, we're proud to be the trusted training partner for hundreds of leading organisations across Australia and New Zealand. From government departments to top corporates, we help teams upskill and succeed everyday

  • 400+ companies rely on Nexacu for team training
  • Trusted by federal, state, and local government agencies
  • Delivering training across 9 countries

Why Nexacu?

step by step courseware

Step by Step Courseware

Custom workbook included with a step by step exercises

Facility Image 2
Facility Image 3
Facility Image 1

Interactive real time training

Interactive, Real-Time Training

Learn with expert instructors, wherever you are

More than 1,300 Business trust Nexacu

Trusted by Business

Procured by Government

Procured by Goverment

Reviews Not Found

Valued by Individuals