Table of Contents
- Introduction
- What are Excel 3D Power Maps?
- How to Use Excel 3D Power Maps
- How to make a Power Map
- FAQ
Introduction
Do you know you can impress your audience or boss in a visually stunning way when you present and graphically represent appealing data across different regions?
Excel comes with more functions you may not be aware of; you can use it to create 3D maps and plot a whole lot of data.
In this article, we'll explore how you can map your data with 3D power or how to make a 3D map in excel.
In the meantime, take a look at what we'll cover in this piece:
Power maps offer impressive uses. You can get a table of data using geographic information and make some stunning 3D maps.
Before answering the "how to make a 3D Map in Excel" question, you may need to understand the meaning and usage of Excel 3D Power Maps.
What is Power Map for Excel?
Excel 3D Power Maps are 3-dimensional data visualisation tools that allow you to view the information in new and stunning ways.
They allow you to discover insights you may not view in conventional two-dimensional (2-D) charts and tables.
Meanwhile, take a look at what you can use Excel Power Maps to do:
- Mapping of data
You can use an Excel power map or Excel power view map to plot over a million rows of data that are visually on Bing Maps in the 3D form via an Excel Data Model or table.
- Find insights
You'll have new understandings by seeing your data through geographic space while viewing time-stamped data change across time.
- Sharing stories
With Excel power map or power mapping Excel, you can share memorable stories.
You can capture some screenshots and create guided and cinematic video tours to uniquely share with audiences. Also, you can create and export tours to video and disseminate them like that.
How to Use Excel 3D Power Maps
For a start, have Excel data with geographic properties in a Data Model or table formats like columns and rows with names of states, cities, zip codes, countries, or latitudes and longitudes.
Here’s how to make a 3D Map in Excel:
- Open a workbook in Excel with table or Data Model data you wish to explore in the Power Map.
- Choose a data table that has a geographical information
- Press on any cell on the table.
- Press on Insert > Map. Pressing on the Map will automatically enable Power Map. In a few seconds, the globe would appear close to the Layer Pane first screen.
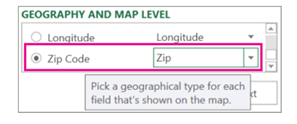
- Under the Layer Pane, you'll verify that the fields are appropriately mapped. You can click on the drop-down arrow for any inappropriate mapped fields to put them to the correct geographic properties. For instance, ensure that Zip Code is seen as Zip under the drop-down box.
- When the 3D Maps plots the data, the dots will show on the globe.
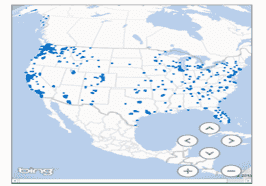
- Press on Next to begin aggregating and visualising the data on the map.
How Do I Do a Power Map in Excel?
For "how do you make a Power Map," here are the steps to start using Power Map:
- Choose the data table with geographic information.
- On the Insert menu, press on 3D Map. You'll be directed to the Power Map window.
- In the Layer Pane location section, add several location fields you can to help you narrow down the data.
- Based on your table data headers utilised to populate the Field List, ‘Map’ the data with the drop-down list close to the field name.
- To know the bar height on the map, add the data you want to map to the Layer Window height area.
- The map will begin to populate.
Now, zoom in on the data geographically, make scenes, take some screenshots, and create your videos.

FAQs
1. What's power map for Excel
Excel Power Map is a 3-dimensional 3D data visualisation tool that allows you to view the information in new ways while discovering insights you may not view in conventional means.
2. How to use 3D maps in Excel?
You can use Excel 3D Maps to track data variables such as sales or performance across diverse geographic regions. Follow the above steps to easily use them.
3. How to enable 3D maps in Excel
Press on any cell on the table. And click on Insert > 3D Map. Pressing on the Map would automatically enable Power Map.
4. How to share a 3D Map in Excel
To share a 3D Map in Excel, take the map screenshot. And share the Excel file with the 3D Map. If you input a 3D Map in the file, Excel will add a text box to inform the user that there's a 3D Map in his file.
For more Excel tips and tricks, check out our Excel Training, available remotely.
 phone
phone
 email
email
 enquiry