
The power of data analytics programs in the past 10 years has become so potent that return on investment of 1300% isn't unheard of. A good grounding in applications such as Microsoft Power BI can transform the day to day life of your business.
What Is Microsoft Power BI?
Power BI is Microsoft's interactive data visualisation software. It is a collection of apps, connectors, and software services that interact to produce insights. Data can be drawn from many sources including webpages, databases, spreadsheets, and other structured files. Power BI transforms this complex data into clear, understandable, and actionable graphs and charts.
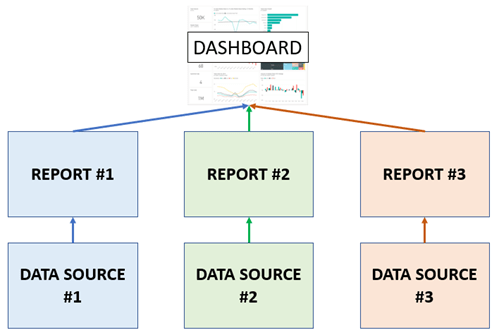
Power BI generally works at two levels - dashboards and reports. Reports are much more complex and hold larger amounts of data whereas dashboards are snapshots of specific parts of reports. Dashboards may be built from multiple data sources/reports. Both are customisable so that you may build what will be most useful for you.
Microsoft Power BI is available as a cloud-based app, desktop software, or as apps for iOS or Android.
Layman's terms: Power BI helps you visualise your data. You may customise this visualisation to show data you believe to be the most useful. Power BI is available across many platforms.
Advantages of Using Power BI
One of Power BI's distinct features is the slick user interface (UI). As with other Microsoft products, emphasis was placed on designing the software to be easy to use and to look good. This is incredibly useful considering an estimated 65% of people are visual learners. The powerful data visualisation service that Power BI offers will help you and your business find clear, actionable insights that are easily understood.
The sheer amount of data available to businesses nowadays means that old business models and tools have become obsolete. You lose valuable time by trying to analyse and find actionable insights by hand. Taking advantage of Power BI will help you understand your data. Contextualizing data is one obvious advantage of using Power BI.
Once your data has been moved into the platform, Power BI performs data analysis to detect patterns. It can then use these patterns to create future rules, making Power BI a powerful tool for predictive analytics. This means you could use Power BI reports to optimise inventory, maximise worker productivity, and offer superior customer service.
Perhaps the most powerful and useful thing about Power BI is its vibrant community of expert users. There are copious templates available that help you to harness your data, which is exceptionally useful if you're just getting started with data science.
If you're new to Power BI, check out the data stories gallery for a look at how you can harness Power BI and to gain a greater understanding of how Power BI is used.
How should Power BI be used?
There is no one-size-fits all way to use Power BI. While the basic concept of a report or multiple reports feeding into a customisable dashboard is the general usage of Power BI, the actual metrics and setup will vary greatly depending on the data available and the purpose of the dashboard.
There are three things you should consider when building your dashboard
1. Purpose
What do you want to get out of this dashboard? Power BI is a powerful and extensive tool. There are many ways to use it. A perfectly valid use for a dashboard is to find gaps to build a further dashboard for. You could find areas you are underperforming in, and go further by dedicating a dashboard to rectifying this underperformance. You must build your dashboard with a clear use as it will make your actions more purposeful.
2. Audience
A dashboard dedicated to improving performance is great - a dashboard no one can understand is not. Considering your audience will help you create a more effective dashboard. There are so many possibilities in Power BI it can be tempting to include as much as you can. But if the powerful insights you are finding cannot be understood by the people who have to action them, your dashboard cannot be considered effective.
Do the metrics you are using make sense? Does the audience of the dashboard know how to action a change in the metrics? These are things you have to consider when creating your dashboard.
3. Data
Even with big aspirations, you are limited by your data. This doesn't necessarily mean you have to scale down what you want to include - you can either get creative or gather the data you need.
But - If as a company you want to improve your sales and think that breaking down your customers by age will help you find a gap, but you do not have information about the ages of your customers, you may be asking for too much from Power BI.
For inspiration, Microsoft publishes stories of rollouts onto their Customer Stories blog. You are able to customise by industry, company size, region, and more.
Power BI Success Stories
Businesses on any scale can benefit from the pointed data visualisation that Power BI provides. We have previously written about several companies that have found success using Power BI.
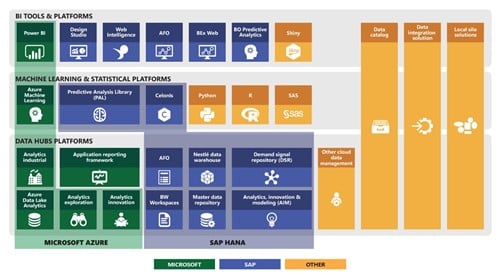
Nestle's adoption of Power BI is an excellent example of the data visualization platform in action. The enormous international conglomerate integrated Power BI into a Microsoft Azure workflow to serve as a bridge between huge data warehouses and localised data.
Nestle's team then uses that workflow to make decisions for nearly 300,000 employees. This setup lets Nestle officials react to data in real-time, giving them a strong competitive advantage.
London's Kings College harnessed Power BI to get around the data silos they had created - a situation in which one information system cannot interact with another system that is related. Think of marketing, HR, finance, sales, and operations teams saving their data in separate systems and being unable to get the information to interact. Data silos are common and create a situation in which data is underutilised.
Because Power BI can draw data from multiple sources, Kings College were able to bring their data together to create powerful insights.
How to Learn Power BI
Although Power BI is designed to be intuitive, a grounding in Power BI will help you create the best dashboards and ensure you are using the most efficient processes. We have a few tips and tricks to get you started:
- Learn through the community
A big selling point of Power BI isn't even a feature that you pay for; there is a substantial online community dedicated to Power BI. Many queries can be answered with a simple
Power BI user groups are also great ways to share and learn. Likeminded individuals get together to discuss power BI and share their own Microsoft stories.
- Listen to the experts
Such is the popularity of Power BI that there are dozens of dedicated websites, YouTube videos, podcasts and much more. This treasure trove of information takes you to every corner of the application.
- Learn from the experts
While there are plenty of ways to learn Power BI free online, these methods are often unstructured and can leave you with knowledge gaps. A base knowledge of Power BI will enrich your understanding of free Power BI content online. A good Power BI introduction course will familiarise you with the platform's extensive controls. It should also teach you most of the fundamentals you'll need. Data science and data visualisation are intensely deep disciplines that are constantly changing and evolving, though, so you'll likely need to find a few Power BI courses to truly master the platform.
At Nexacu, all of our trainers are Microsoft certified and have contributed to designing the courses. Their contribution ensured the courses will endow you with skills to take back to the workplace, taught by people who understand your skill level.
It's unbelievable how much of a difference structured learning can make when learning a business intelligence platform. It's beyond useful to have someone take you by the hand and show you where to start, where to stop, and all of the steps along the way. It takes the guesswork out of your entire enterprise so you can focus on exactly what works.
- Get certified
To really impress, get Microsoft certified. This is a qualification independently verified by Microsoft that demonstrates your knowledge level. If you are looking to use Power BI as a qualification on your resume, a certification is the best route to stand out.
Microsoft offers a certification called the Data analyst associate, ascertained by passing the DA-100 exam. At Nexacu, we have a certification program designed by our Microsoft certified trainers to help you pass the pass.

Looking for Software Training?
It's unbelievable how much powerful technology is so easily available today. It's a lot to keep up with but it's more than worth it! 20th Century entrepreneurs would have given anything for 1/10th of the technological tools we have today.
Whether you're looking for Microsoft Power BI courses or to learn how to program in popular languages like Python or R, you'll find world-class education and individualised training with our instructors. Get in touch to get a quote and begin upskilling your team immediately!