
Microsoft’s Power BI continues to dominate the market as the preferred business intelligence software. Let’s have a look at the trends in Power BI as well as what could happen in the future.
Power BI on the go – Mobile BI
The pandemic accelerated the shift to greater workplace flexibility and mobile Power BI is enabling that shift. Greater accessibility to Power BI dashboards allows employees to let data drive their decisions, no matter where they are.
One of Microsoft’s continued strengths is the broad reach of their software – not just it’s range but the mobile use of it - that stems from Microsoft’s continued commitment to consolidating and expanding its market share. The Power BI app is easy to use and allows employees who aren’t always in the office or can’t use their laptops to access important insights that drive productive and efficient decisions.
The immense potential for business software to become more mobile-friendly cannot be understated as we spend increasing amounts of time on our phones. The importance of mobile tech is underlined by the fact that 56% of all Google searches are completed on a mobile device (Internet Stats & Facts, 2021).
Small Businesses and Power BI
Flexible licensing has always been at the core of Power BI’s model. In the past, business intelligence has been for big businesses only, with heavy hitters able to afford highly-educated business analysts to draw insights from the data manually. The user-friendly interface and flexible pricing have allowed small businesses to take the first step toward adopting Power BI for themselves and taking advantage of the insights now available to them. We predict this trend will continue; with small businesses realising their potential through Power BI.
Already, some have posited that over 46% of small businesses utilize the virtual networking features of Power BI. We will see more and more small businesses using business intelligence software as a core piece of their business strategy (Anthony, 2022).
Power BI Internationally
The US is Power BI’s major market; this is no surprise considering Microsoft’s ‘home advantage’ and the sheer magnitude of business that occurs there (Enlyft, n.d.).
It is likely that Microsoft Power BI will see an uptick in use across the world, especially in Southeast Asian financial centres such as Singapore, regardless of Tableau’s market position.
Power BI’s popularity continues to grow and its dominance as a leader in the space is again recognised by Gartner, in the Magic Quadrant for Analytics and Business Intelligence Platforms, 2022.
Embedded Analytics and Reports
Despite great strides in technology in the past two decades, there is still not a singular piece of software that does it all. This could be attributed to many things; a lack of demand because of different needs or it may be considered unnecessary because of the capabilities of other platforms. Instead, we see that we can embed aspects of some software in other places.
This is an option in Power BI. Power BI reports can be embedded in many places such as on an internal site or SharePoint site. We may see increased use of the embed feature for businesses to disseminate the data to a wider audience to gain a competitive advantage.
AI and Trend Analysis in Power BI
AI has been a mainstay of businesses for years. Already, artificial intelligence is used for engaging with customers and employees; cast your mind to the automated chat boxes on so many websites for a prime example of how AI can be used.
AI can be used to automate data analysis and cut down on manual labour that may be inaccurate and inefficient. The most obvious example is marketing; companies collect information on their customers to analyse their behaviours and target campaigns towards them. Although this is all very ‘big brother’, it is pervasive, especially in the retail sector.
To make these campaigns as effective as possible, data needs to be gathered and analysed properly and this is where Power BI comes in. AI built into the application can be used to create real insights that may not be picked up by a human. The predictive analysis in Power BI could translate into massive returns and we are predicting greater use of the predictive capabilities of Power BI.
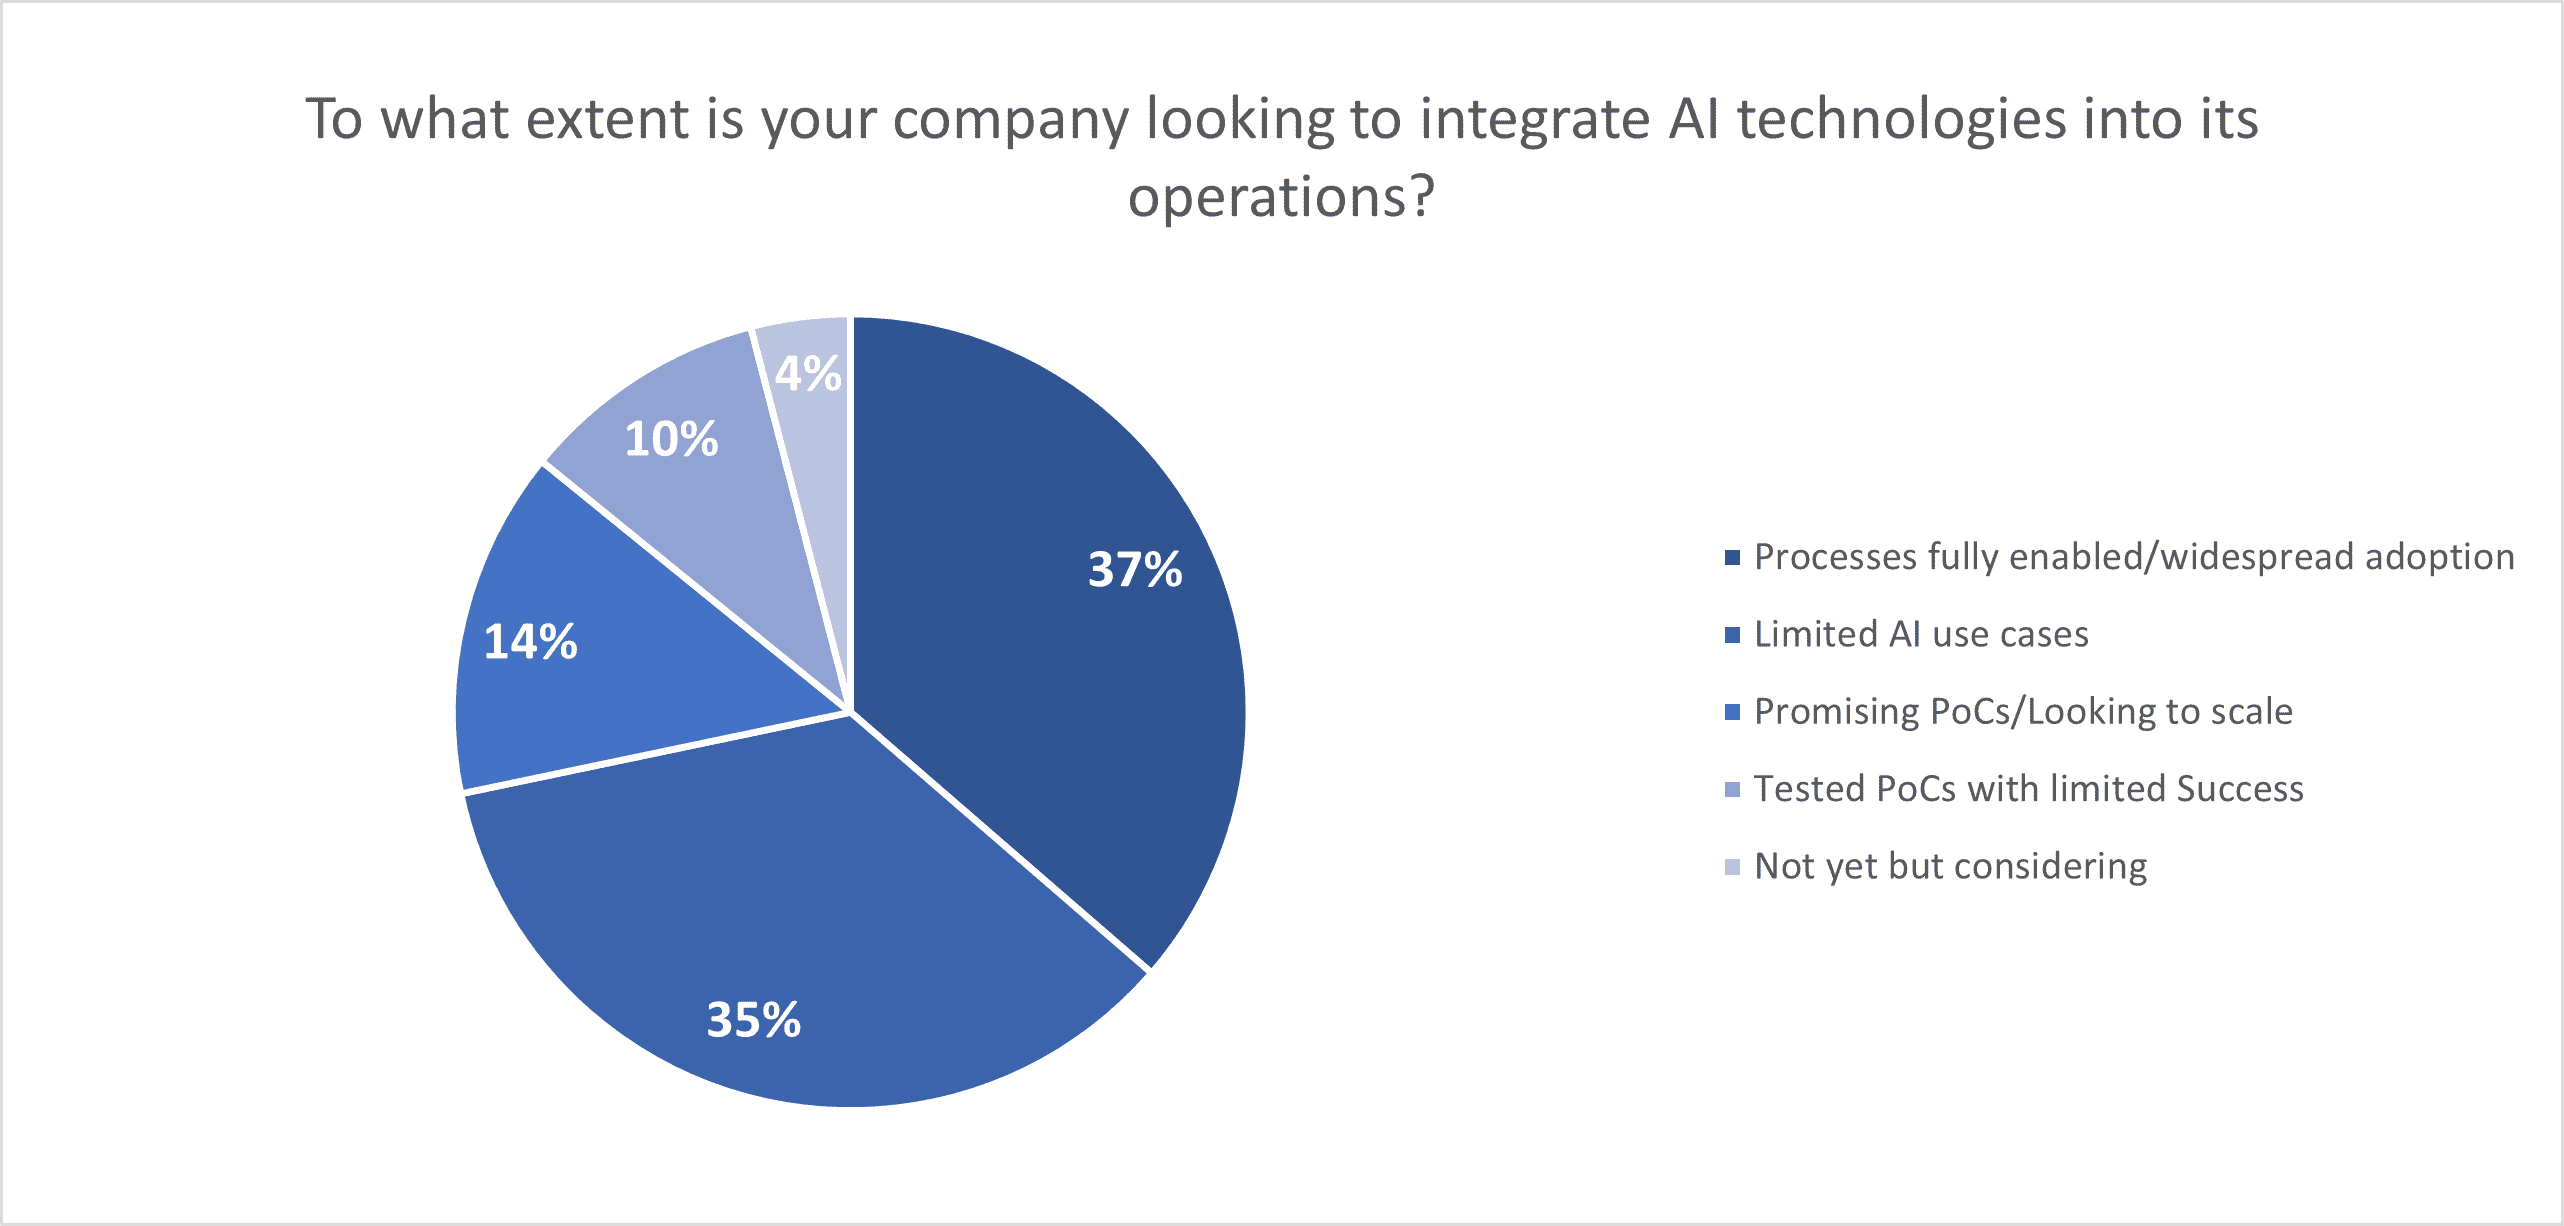
There is also the ability to use AI to analyse competitors to find an edge. In a survey of 1,000 technology executives by PWC, 37% of businesses already have widespread adoption of AI technologies and a further 35% already use it in a limited sense.
The Coles group is working with Microsoft to use AI and advanced analytics to delve deeper into flybuys and transaction data to learn more about their customers and tailor their products to customer needs and changing customer expectations (Media releases | Coles Group). They are also using data to drive more efficient and automated processes and operations to increase profitability (Coles takes trip down the aisles with Microsoft, spurring transformation with AI and cloud to help Coles win in its second century – Microsoft Australia News Centre). Coles has chosen to use Microsoft's Azure cloud platform to deploy these solutions; Power BI is the obvious choice for reporting and visualisation of Azure data.
Catholic Schools NSW is utilising Power BI to streamline and centralise data sourced from multiple systems to make it instantly available and usable. The way they use the data has the potential to improve student outcomes and manage their reporting obligations. The integration of Power BI represents hundreds of saved hours by automating previously manual processes. Having access to combined data from multiple sources is opening up new analytical possibilities including predictive analytics and machine learning models (Catholic Schools NSW chalks up big data and analytics win for schools and students | Microsoft EDU).
Storytelling with Dashboards
Storytelling is an essential part of almost every job and Power BI is one of the most effective ways to tell (and sell) a story. The ability of Power BI to transform data into exciting and informative visuals will take your storytelling to a new level. With 65% of people being visual learners (Spencer, 2018) enticing and understandable visuals are a must. Pair these visuals with an attractive narrative to sell your story.
Scaling UP
There are many stories on the Microsoft website that detail the transitions made by companies both large and small to large-scale integrated Microsoft systems. This trend of scaling further and further up is likely to continue in 2022. This is not just a reflection of the immense capacity of Power BI but of the progression of technology. As we demand more and more of our data both in size and quality, we will require increasing power to store, analyse, and visualise it.
As already mentioned, the success of Power BI and other business intelligence software will likely attract new players that see the gap for one centralised system and fill it. In the next 5 – 10 years, it may be industry standard to have BI capabilities integrated into existing systems, such as your company’s CRM.
Tech giants will likely be at the forefront in a continuation of the ‘data revolution' as they are among a small number of organisations with the financial and technological reach to scale data storage in a way that satisfies industries' growing needs. Data centre-related M&A reached $32 billion in 2020 (Kar et al, 2021) and has continued since. Data warehouses – a data management system built with business intelligence in mind that generally stores large amounts of historical data and supports analytics and BI activities – will start to become more common.
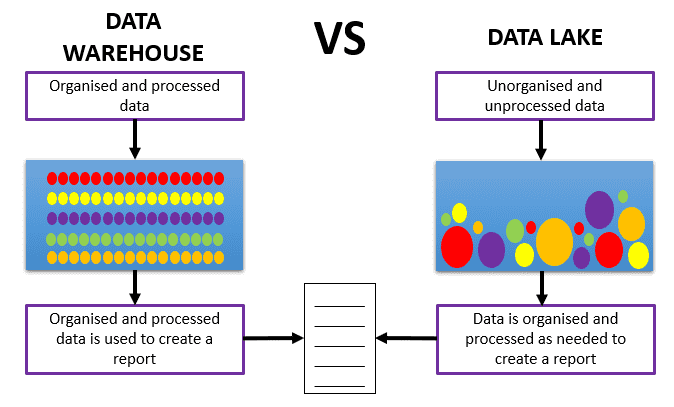
Data preparation is a big issue, with companies choosing between a data lake and a data warehouse depending on the needs of the organisation. Data Lake vs Warehouse: as illustrated, the main difference between a data lake and warehouse is how data is stored. A data warehouse is stored with the data already organised and processed, whereas a data lake holds unorganised and unprocessed data.
Collaborative BI
Collaboration is at the heart of any successful venture. Bringing together many people with different skill sets will ensure that your project will achieve it’s potential. Being able to share the final product and share the ability to edit will greatly improve the outcomes of your report. Access to the best and most up to date data will drive better decisions.
The trend of democratisation of data will continue, with data becoming accessible to more and more people. Instead of wondering what the numbers are, employees of all levels will have access to data that impacts what they do every day.
In practice, Power BI can act as an intermediary between managers and employees of different levels. Think of a manufacturing business: Power BI can help identify points of weakness and bottlenecks and enable managers and those on the floor to collaborate on solving problems. The right data can help solve almost any problem.
Conclusion
It remains to be seen how Power BI will be updated in 2022 to meet the demands of industry and whether the above trends will continue. What we do know is that the field of business intelligence is rapidly evolving and we're likely to continue seeing exciting changes in this space.
Our resident data analytics course developer and trainer Dr Tamara Shatar has stated that: "Over the last few years, we've seen a lot of businesses and organisations that have traditionally relied on Excel for most of their analytical needs send their employees to us for training. They are wanting to do more with their data in more efficient ways."
To get ahead of your competitors, implement Power BI in your business. For thorough and practical Power BI training, choose Nexacu. See our Power BI Beginner page.
We also offer training in complementary skills, such as SQL, R and Python. Take a look at our detailed course outlines. If you don't find exactly what you need, contact us about consulting and bespoke training.
Reference List
Internet Stats & Facts. (2021). Website Setup.
Anthony, J. (2022). 51 Essential Business Intelligence Statistics: 2021/2022 Analysis of Trends, Data and Market Share. Finances Online.
Companies using Microsoft power BI. (n.d.). Enlyft. https://enlyft.com/tech/products/microsoft-power-bi
Spencer, E. (2018). How to work best with the 4 different types of learners. Atlassian.
Kar, N., Gafni, J., Hoolihan, N., & Landridge, W. (2021). So hot right now: Booming foreign investment in data centres faces regulatory heat (Part 1). Linklatrs.