
What is Power BI?
Microsoft Power BI is a cloud-based service for reporting, data visualisation, and business intelligence that provides data analytics solutions and services for individuals and teams. It comprises various services and products. Its value, versatility, and flexibility come from leveraging individual elements and taking advantage of how they work in unison.
What is good about Power BI?
If you need a flexible and versatile data analytics and business intelligence tool, here are five reasons to love Power BI.
1. Reasonably Priced
Power BI's best feature is its affordability - Power BI Desktop is free. You can install it on your computer and you will be able to connect to data sources and build reports. It has various out-of-the-box features to manipulate and display data.
Power BI Service solution is available for AU $20.00 per user per month. Working with Power BI Service, you can create dashboards from your reports and securely share data, reports and dashboards.
2. Amazing Data Visualisation
Power BI is known for its eye-catching, intuitive, user-friendly and interactive visualisations. Visualisations transform data into charts, images, and graphs. In Power BI, visuals are created and added to reports using drag and drop functionality.
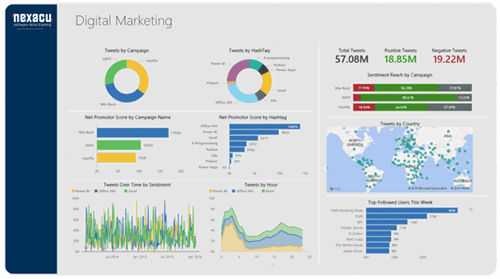
Power BI enables users to create immersive, visually compelling reports that can be explored interactively and collaboratively for historical data sets and real-time data. We can create reports, bar charts, line charts, pie charts, maps, and a wide range of custom visuals. Working in Power BI Service, visuals from one or more reports can be pinned to create dashboards. Check out these Power BI Visualisation examples and learn more.
Power BI allows users to work interactively with reports for example by applying filters or selecting data of interest. This interactivity makes working in Power BI very efficient; users can slice and dice or drill down into data to derive their own insights. A single interactive report can replace potentially hundreds or thousands of static reports.
Power BI has a wide range of custom visualisations made by developers for specific uses and various customised visuals in the Microsoft marketplace, including KPIs, graphs, charts, maps, R script visuals, etc.
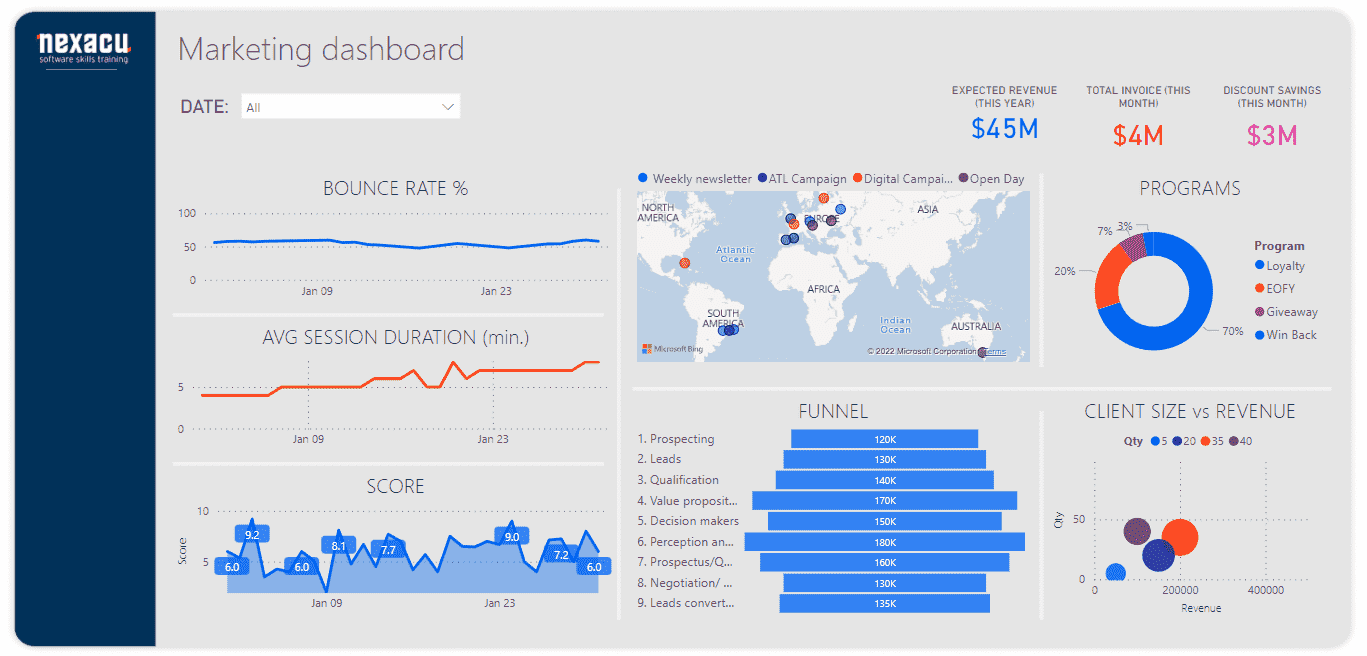
Dashboards are used to present an overview of the most important business metrics. They can contain visuals or pages from multiple reports and users can click on visuals to link to the original report and explore related visualisations of interest. Users can create their own personal dashboards and see all the data of interest to them in one place when they log into Power BI. Data can come from several sources to have a dashboard with customer data from Dynamics CRM, Marketo, and your ERP system.
3. Works Anywhere Across Devices
Power BI empowers people and organisations to work wherever and whenever needed. It works on iOS, Android, and Windows devices, allowing the organisational insights offered by Power BI to be accessed on any device.
Remote work is the new norm that requires us to work from various geographic locations and different computers, operating systems, and working environments for which cross-platform interconnectivity is essential.
Users can email reports to anyone in their organisation, providing the latest view of the report and data. Once you create a report, for example, one showing an increase in revenue, you can send the link to your sales manager, and they can log in at any time to track the progress.
Although you can also build on the report, change it, or create new ones, but you no longer need to send reports and numbers via email.
With Power BI, we don’t have to deal with the hassles of moving data around to understand it. Instead, it connects directly to hundreds of data sources from any location – in the cloud, on-premise, or within spreadsheets. Power BI doesn’t care where or what data type it is. Power BI connects to it and helps us make sense of it, whatever and wherever it is.
Microsoft has Power BI apps for Apple, Android, and Windows mobile devices so that you can see your dashboards anywhere.
4. Data Analytics
Another cool Power BI feature is that it can combine data from different files, databases and web services with visual tools that help us understand and fix data quality and formatting issues. Power BI can combine all an organisation’s data, whether in the cloud or on-premises and provide a single source from which the data can be accessed, analysed, and viewed. Embedding Power BI reports and dashboards makes for a truly unified experience if you already have reporting portals or apps.
Power BI connects to different data sources and it also allows for a scheduled data refresh You can set up a connection to your data and have it automatically periodically refresh so that your data is always up to date.
Power BI has many chart options, plus developers can build their own.
Power BI allows us to analyse data by asking it questions in plain English— no unique code or syntax is required. This feature is known as “natural language queries,” and it allows us to ask Power BI to perform tasks just like you would ask one of your colleagues. Type in a question like “What is the total revenue for this year?” and Power BI will generate an answer. You can also tell Power BI to present the answer as any visualisation you prefer, and that’s not all; you can pin the result to a dashboard so you will see both your query and its answer when you log in.
For more complex analysis, Power BI is equipped with its own programming language that can create formulas using the DAX language. Developers can also choose to build their own custom visualisations to complement the many chart options available in Power BI and the custom visuals available through Microsoft AppSource.
5. Display Data From Multiple Sources On One Screen
Power BI can pull data from a large number of data sources. We can import data from Salesforce or CRM, your ERP systems like Oracle, or Microsoft Dynamics. It connects to a website and pulls down a data table directly from the HTML. It joins and creates interactive reports that can be presented to the company's board! You have the power to connect data from all these different sources and build relationships between them, then transform the data into amazing-looking reports that you can view centrally and share easily.
Loading data from various sources is simple. Some of the Power BI cool features allow easy connection to multiple files and merge data. Similar to Excel and CSV files, you can connect to a hundred different types of sources, for instance, Google Analytics, Microsoft Azure, SalesForce, etc. All we need to do is to drag and drop checkboxes to get the work done.
An example of a time-saving trick is that we can merge multiple CSV files into one table without opening the files, copying/pasting, or coding. Power BI can handle 11 million rows easily, which is ten times more than what Excel can handle.
Why is Power BI better than Excel?
Power BI has many advantages over Excel, including:
- It is easier to create visualisations
- Data, reports, and dashboards can be securely shared
- Content can be accessed via the mobile app
- Row-level security in Power BI can be used to grant users access to subsets of the data, preventing them from accessing any other data in the dataset
- Power BI can handle larger datasets and you can schedule data refresh
Why do I love Power BI?
Power BI is a great tool for exploring data and for collaborating and sharing insights with others. It's easy to learn and easy to use and is a great tool for supporting data-driven decision making.
Find out what Power BI course is right for you.