Dashboards

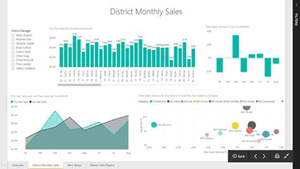
How To Create a Power BI Dashboard from a Report

Microsoft Power BI is a fantastic interactive data visualisation software product used for data analytics, business intelligence, and visualisation. It is a part of the Microsoft Power Platform, and it comes with cross-platform connectivity and a multitude of services. Learn how to create a dashboard from a report in this article.

How to Become a Data Visualisation Analyst

Big data is playing a greater role in almost every industry. On the back of our increasing reliance on data to make decisions, many new types of roles are emerging, including that of a Data Visualisation Analyst. 

5 Reasons To Love Power BI
5 Reasons why we love Power BI!
Power BI's unique benefits and inclusions undeniably distinguishes it from its competitors in the business intelligence platform market. In this article, find out exactly what these 5 features are and why we love them so much.
Power Platform in practice
The Power Platform: tools for better business

Is this your own project or part of a team? Are there many deliverables or very few? These are critical factors in determining the right task management software.

nexacu software training
Keeping Up With Technology in 2020

The past decade has seen technology radically change almost every aspect of business management and development strategy. So it's crucial for companies looking to progress in 2020 to aim to be just as dynamic and adaptable as the technology they utilise. Making progress in the three key areas below will support you and your team in reaching your goals for 2020.

Power BI Top Trainer Picks
Top Trainer Picks Microsoft Power BI

Discover Nexacu trainer Matt's top software pick for May - Microsoft Power BI. Why end-users need to Learn Power BI.


Topics

SQL
css

Contact Us

Why Nexacu?

Valued by Individuals

4.72 / 5
Over 76271 Reviews

Trusted by Business

Procured by Government

Awards and Accreditations

Follow us