Code for Data Analysis
Using code-based tools for data analysis
Recently, we have been providing training in R and Python to a large number of professionals who are migrating from other code-based analytical packages such as MATLAB, Stata, SAS and SPSS. We have also received a number of enquiries about how R and Python compare to these tools. This post outlines some of the reasons for using code-based tools and why organisations are increasingly using Python and R for their data analysis needs.
Why code?
Working with code can offer greater flexibility when conducting analyses and create reproducible, reusable and reviewable workflows. Because of their reusability and potential for automation, they can be more efficient than using repetitive point-and-click operations. Reviewable code also reduces the likelihood of errors going undetected.
MATLAB, Stata, SAS and SPSS are all commercial software programs used for statistical analysis that include a coding or programming language component, usually combined with some point and click functionality. Python and R are the two most popular programming tools for data science. They are considered to be the more powerful tools for data analytics but are more difficult to learn to use.
Which tool is best?
The answer to this question will often depend on who you ask. Specific software packages often have a history of being used in a specific discipline. Many organisations continue to use software they have a history with because of legacy code and the skills and experience of their workforce. For example, MATLAB is popular with engineers and scientists and Stata is used extensively in econometrics and health research. Many of these tools meet the current needs of their users. However, as organisations adopt more complex analysis techniques, such as machine learning, R and Python can offer more timely access to more sophisticated algorithms.
Functionality
All of these tools are considered powerful and comprehensive and can perform quite complex analyses. However, R is extremely powerful because its functionality has been developed by a large community of high-level users over decades. R is widely used in academia by researchers and statisticians and others who develop new algorithms and make them available as R packages. Many of the functions implemented are published in peer-reviewed journals. This means that functionality is often available first in R. It can be several years before functionality is implemented in other software packages. R is also well-known for producing high-quality graphics.
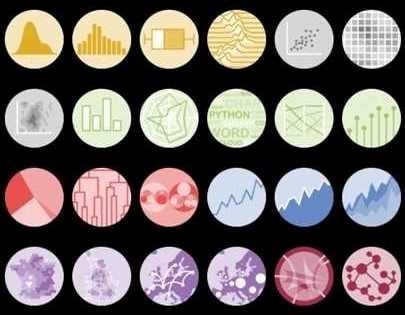

Explore More R Graphics here.
Similarly, Python has a community of high-level users who have implemented much of the common functionality available in R into packages for use in Python. However, Python is increasingly used for research in artificial intelligence, particularly deep learning, and may have an edge over R for these applications. One of the advantages of Python is that because it is a general purpose programming language, it can be easier to integrate into other applications, for example, into a web application.
MATLAB, Stata, SAS and SPSS offer less functionality than Python and R. However, Python and R scripts can be used directly from those programs, offering the best of both worlds.
Should I learn Python or R?
Python is a simple, general-purpose programming language. It has become popular with data scientists because of packages like NumPy, pandas and scikit-learn. R is a statistical programming language, developed specifically for data analysis and visualisation.
Individuals with programming experience often find Python simpler to learn to use; whereas non-programmers are often more comfortable starting with R. Once you've learned either Python or R, it is quite easy to learn the other.
Cost Savings
One of the most obvious differences between R and Python and the commercial software packages is the cost. A major benefit of R and Python is that both are free to use even for commercial business applications. Annual subscriptions for business or government users of commercial packages like MATLAB, Stata, SAS and SPSS start from just over $1,000 and can exceed $10,000 for just a single licence. Users are often required to pay more for extra features such as increased speed or additional functionality.
For many businesses, the benefits of accessing more powerful analytical tools outweigh the costs of upskilling their workforce to use R and Python. Others are finding that a move to freeware makes good financial sense. To make this process easier, Nexacu offers 12 weeks of free consulting and support after attending our Python and R course series. See our website to learn more about upskilling in Python and R.
To learn more about Python, check out our Python Training Courses. Use the skills test to determine where you sit and then book into our basics, data analysis in python, and python intermediate. We also offer python certification. Available in person in our CBD locations or remote online across Australia.
Likewise, we also offer certification in R as well as a basic course, beginner course, intermediate course and a machine learning in R course.