Creating groups
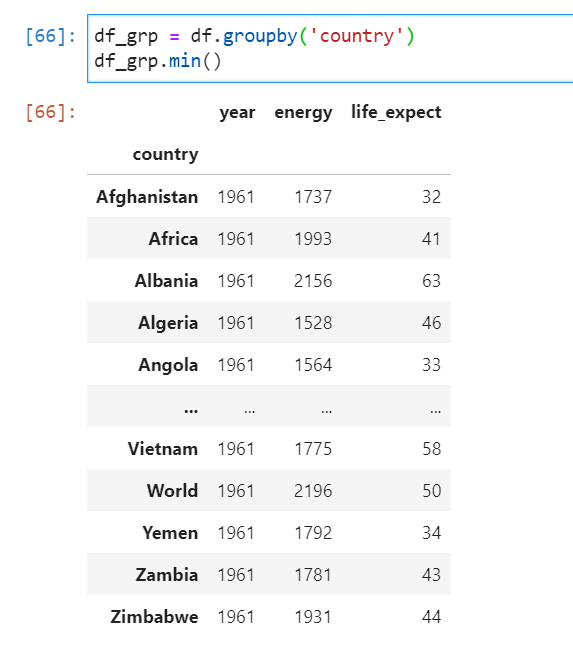
In this example, we will work with a DataFrame that contains annual life expectancy and food availability (energy) data for 175 countries.

We can group by country and use the resulting groupby object to simplify reporting group statistics:

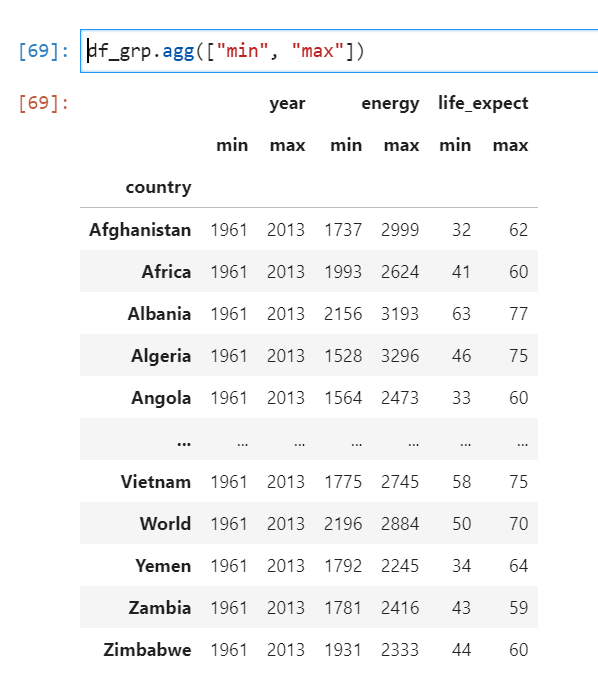
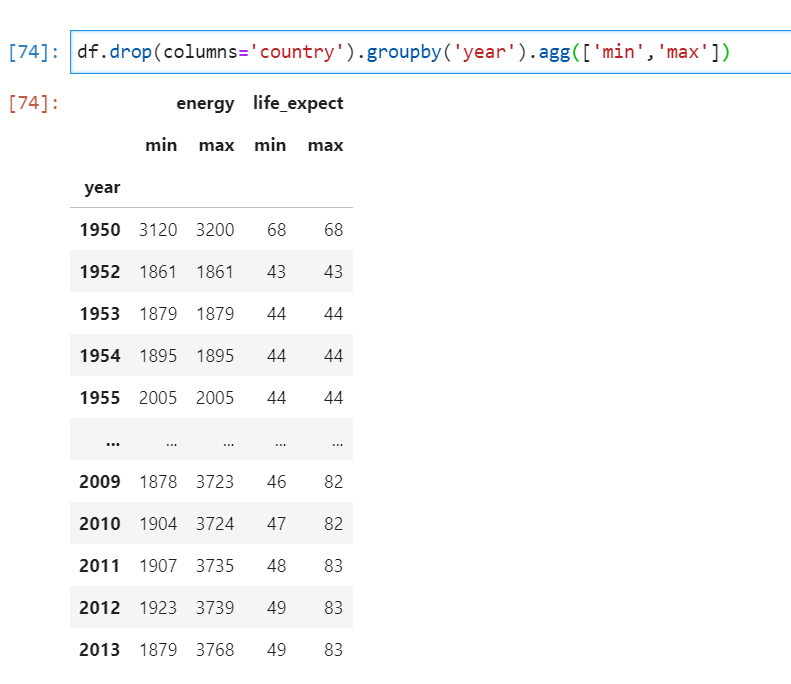
To report multiple statistics for each group, we can use the groupby object in combination with the agg() (aggregate) method.

Alternatively, we can change the grouping criteria, to instead report summaries of values by year.

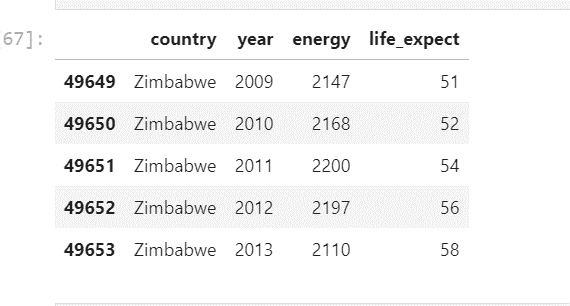
Accessing groups of data
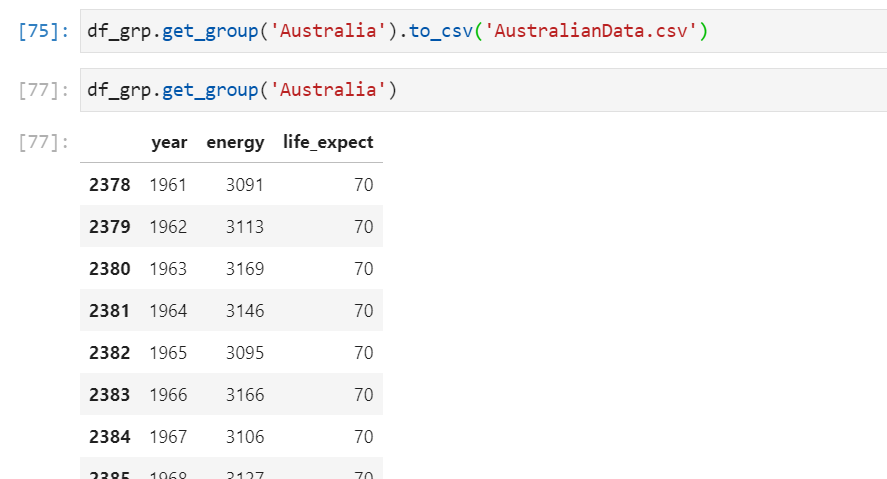
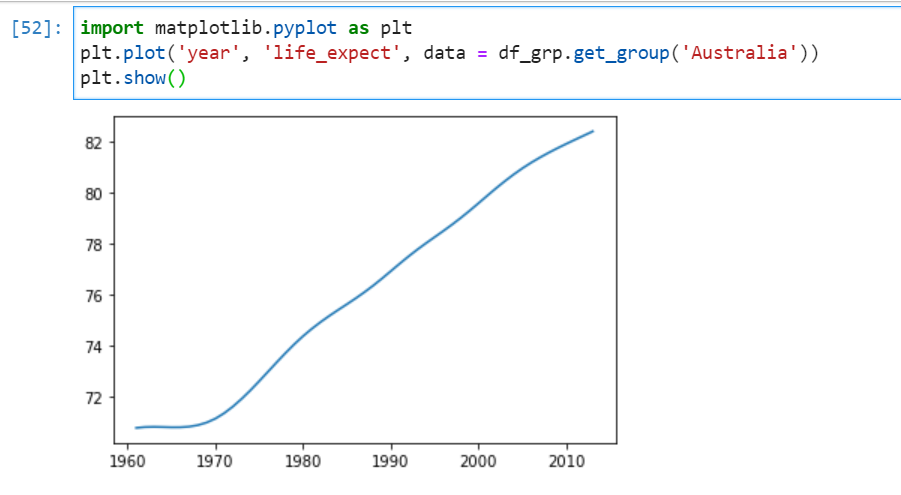
Individual groups can be accessed from the groupby object using the get_group() method. It can be used to simplify accessing subsets of data for exporting or other operations, like plotting.


Looping
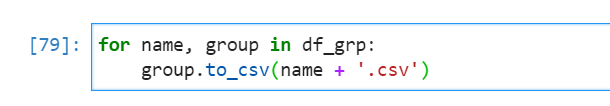
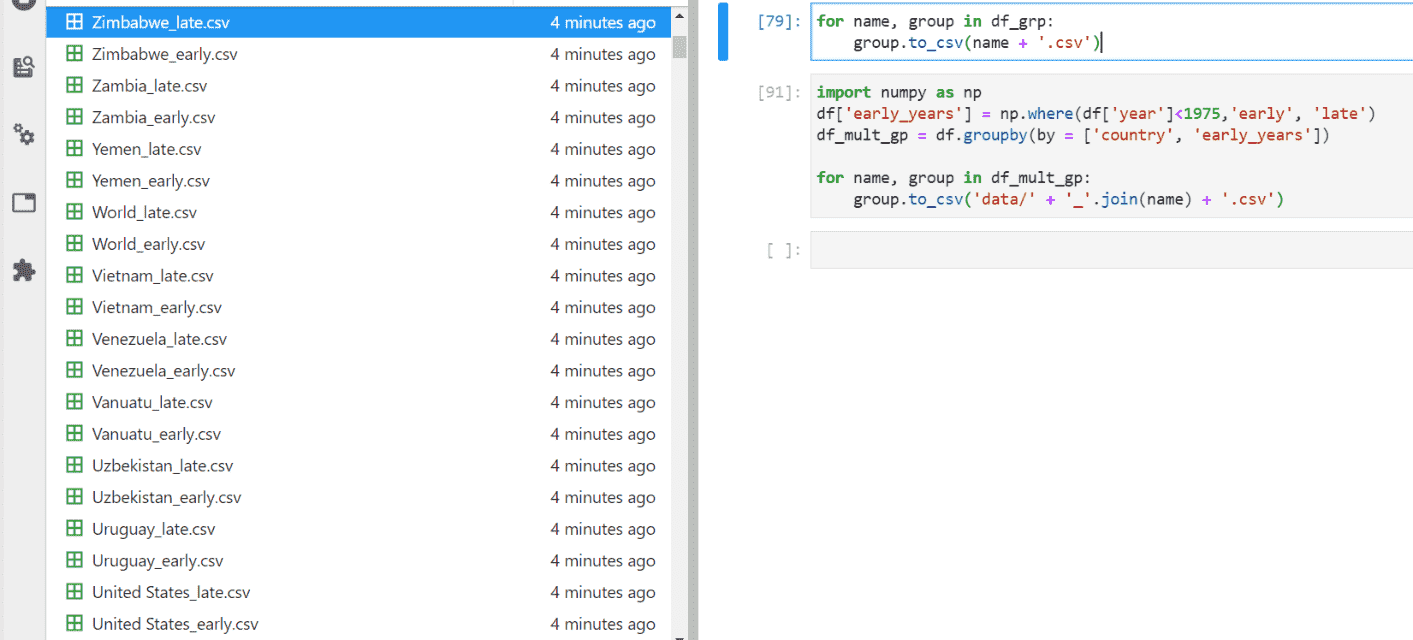
The groupby object can also be used to perform iterative operations. We can loop over each group, retrieving both the data and the name of the group. The name of the group is the value of the variable used to group the data. The code below can be used to automate the process of exporting each group to its own csv file. Each file is saved with the group name.

By grouping on multiple columns, we can avoid using nested loops. In the example below, a column has been added (early_years) that indicates whether the data was collected prior to 1975 or after this date. By grouping the data on both country and entity, we can send data for each country, to two separate files; one for data prior to 1975 and one for data collected since 1975. Note, that the group names consist of tuples. These have been concatenated using the join() function to create a single name from each element of the tuple.

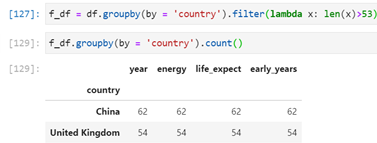
Filtering on number of data points
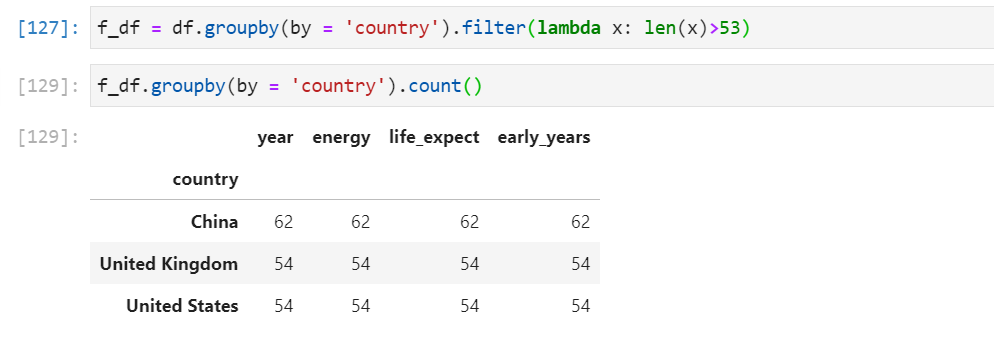
The groupby() method can also be used to determine the total number of rows of data for each group and used in combination with the filter() method to remove groups if they contain insufficient data.
The first line of code produces a regular DataFrame, that contains data only for those countries that have more than 53 years of data. By regrouping and reporting the count, we can see how many years of data are available for each of the remaining groups.

Learn more about Python, check out our Python Training Courses. Use the skills test to determine where you sit and then book into our basics, data analysis in python, and python intermediate. We also offer python certification. Available in person in our CBD locations or remote online across Australia.