
Power BI for Beginners: How to Build Your First Dashboard in 30 Minutes
Our Power BI Beginner course walks you through this and more in a full day of instructor-led training — in-person or remote across Australia — with practical exercises and repeatable dashboard layouts.
In real workplaces, dashboards aren’t about showing “everything”. They’re about making the important things obvious: key totals, trends over time, and what’s driving changes — without needing to open five spreadsheets and a sixth sense.
This guide explains how dashboards work in Power BI (and why beginners get stuck), then takes you through a simple 30-minute build you can reuse for sales, service delivery, operations, finance, or project reporting.
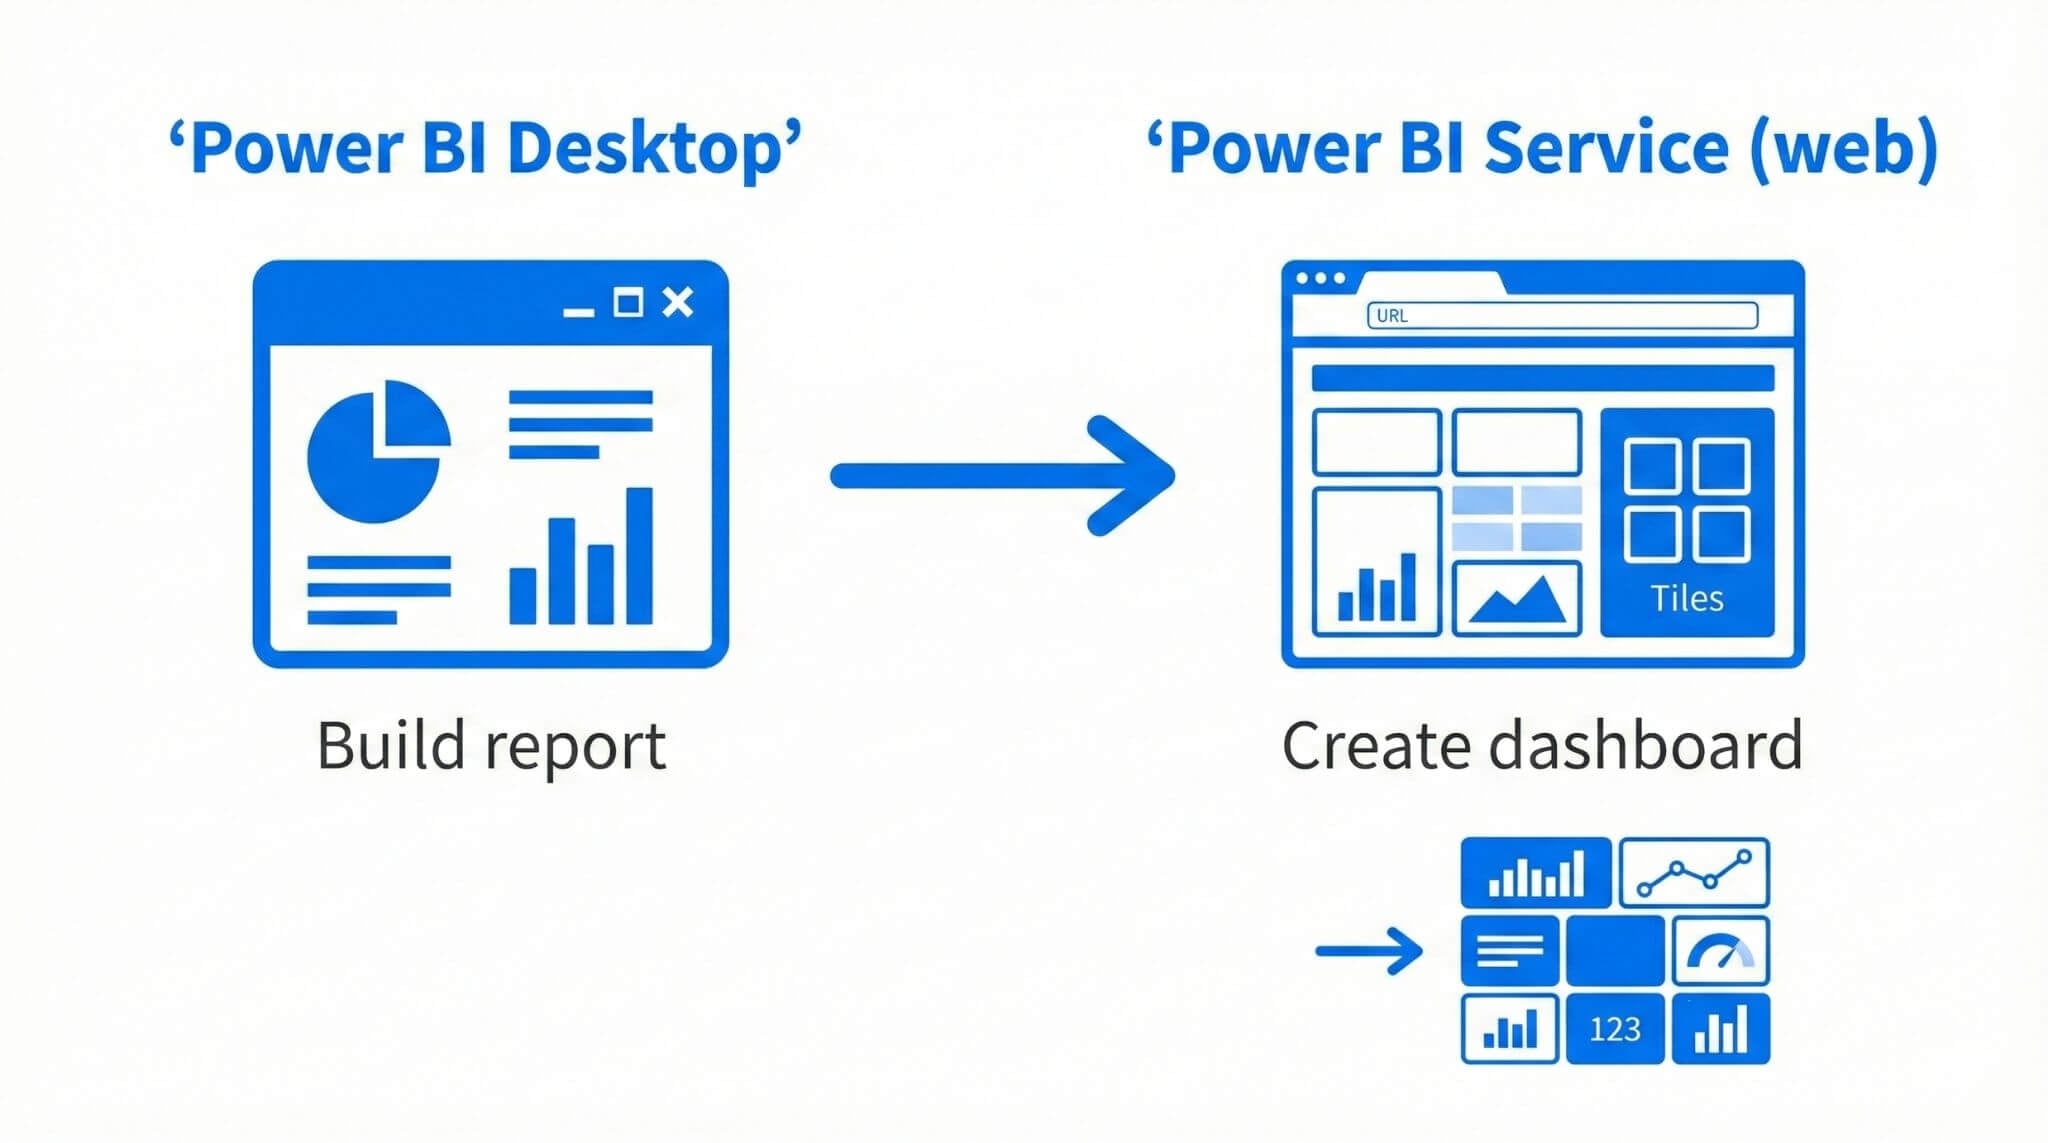
TL;DR: Build a clean one-page report in Power BI Desktop (KPIs + trend + breakdown), then publish and create a dashboard in the Power BI service by pinning the most important visuals as tiles.
A good beginner dashboard answers three questions: What’s the number? Is it improving? What’s driving it?
1) What is a Power BI dashboard (and why use it)?
A Power BI dashboard is a single-page view made up of tiles (pinned visuals). It’s designed for monitoring: quick checks, regular reporting, and “tell me what changed” conversations.
Dashboards are most valuable when the business agrees on the definitions behind the numbers. If everyone’s using the same measures and the same data source, the dashboard becomes a reliable “source of truth” rather than a debate starter.
- Sales performance and pipeline summaries
- Service delivery (SLA and backlog monitoring)
- Operations reporting (volume, exceptions, delays)
- Finance snapshots (budget vs actual, trends)
- KPIs are defined clearly (everyone agrees)
- Layout is predictable and easy to scan
- Tiles lead to detail (reports) when needed
- Only includes decision-making metrics
2) Report vs dashboard vs tiles: what’s the difference?
Power BI uses a few terms that sound similar. Understanding these early makes everything easier:
Creates a dashboard tile from one visual. Great for quick monitoring, but it behaves like a standalone tile — it doesn’t interact with slicers the way a full report page does.
Pins an entire report page as a live tile. This lets users interact with elements on that page (including slicers) directly from the dashboard tile.
Rule of thumb: Pin a visual for KPIs. Pin a live page when you want slicers and interactions available on the dashboard.
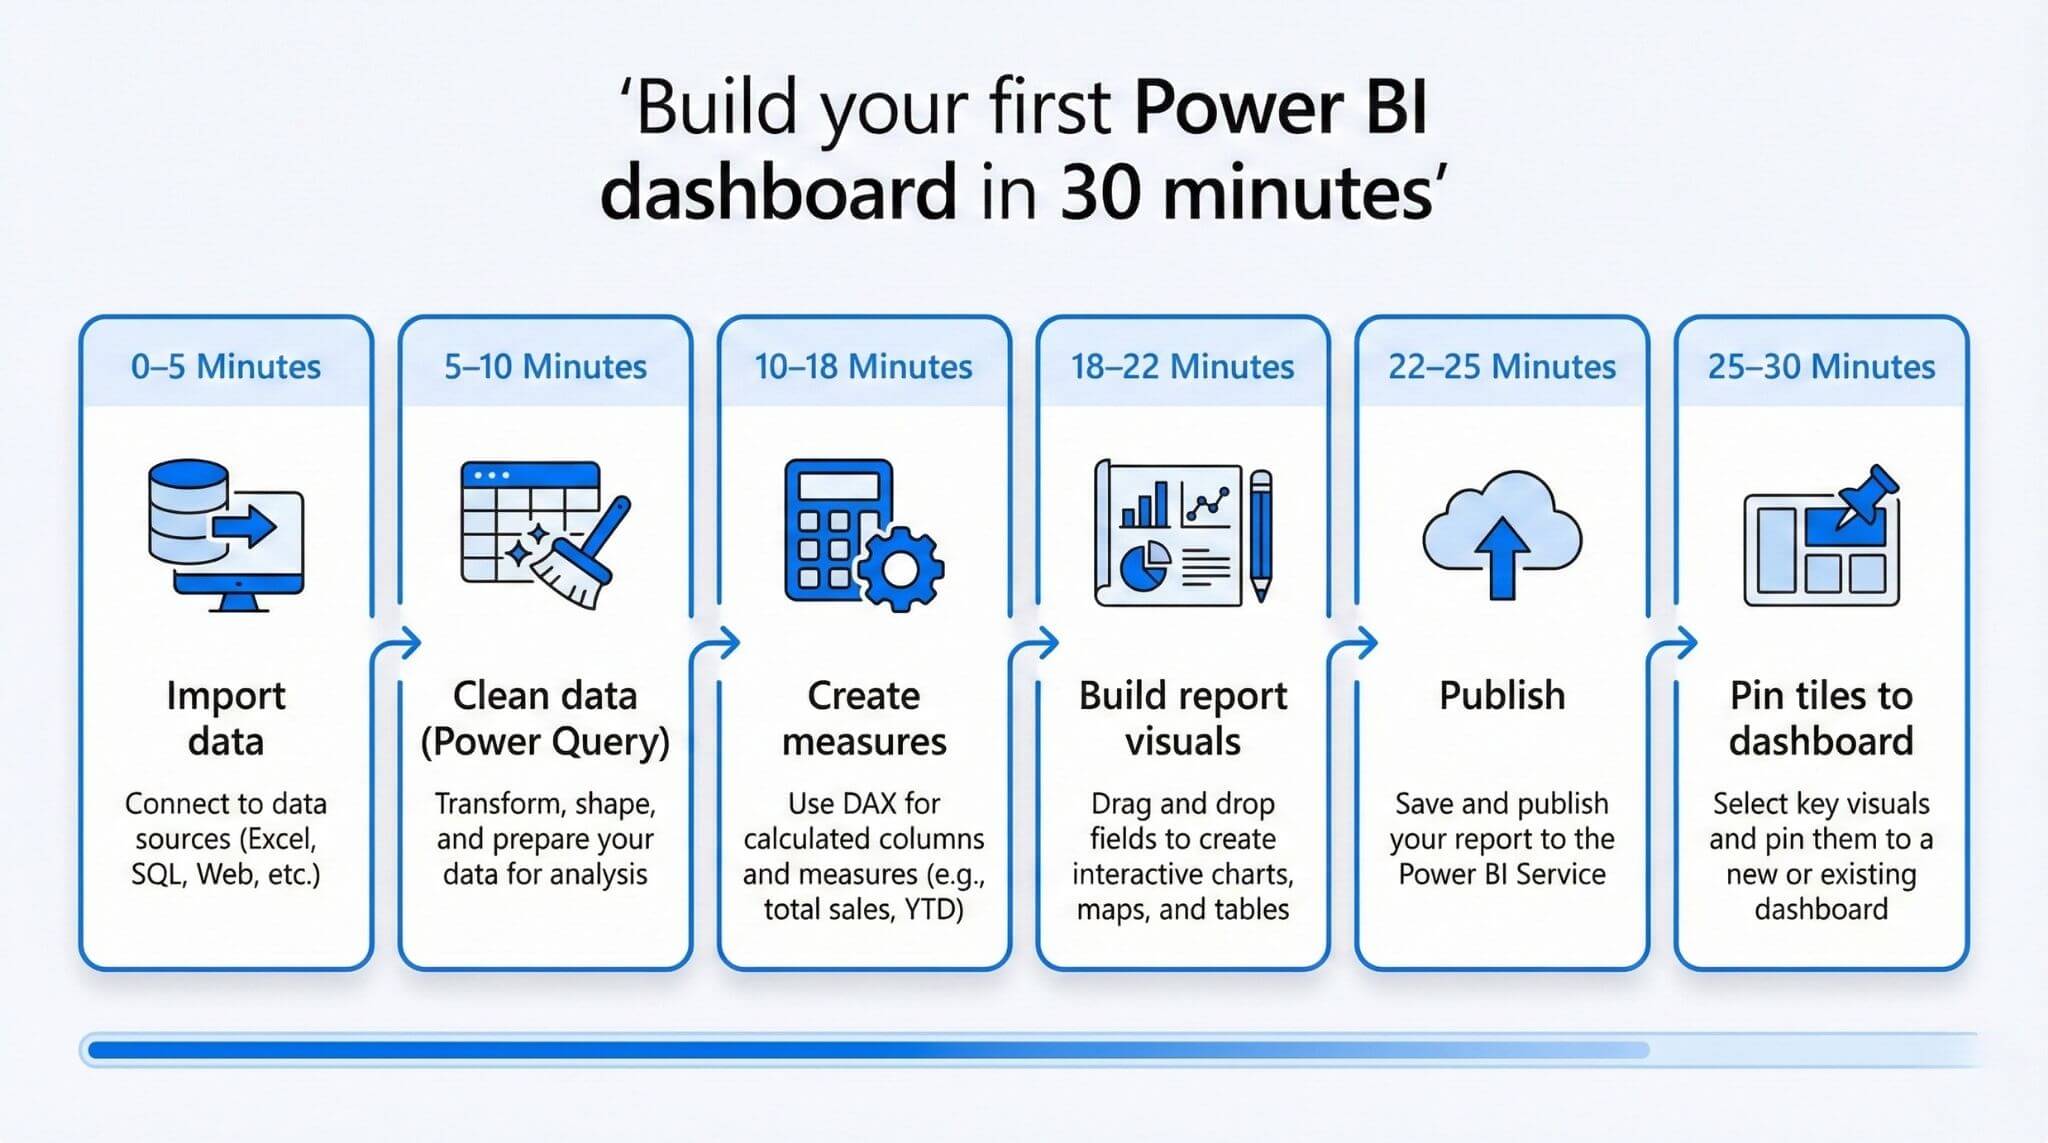
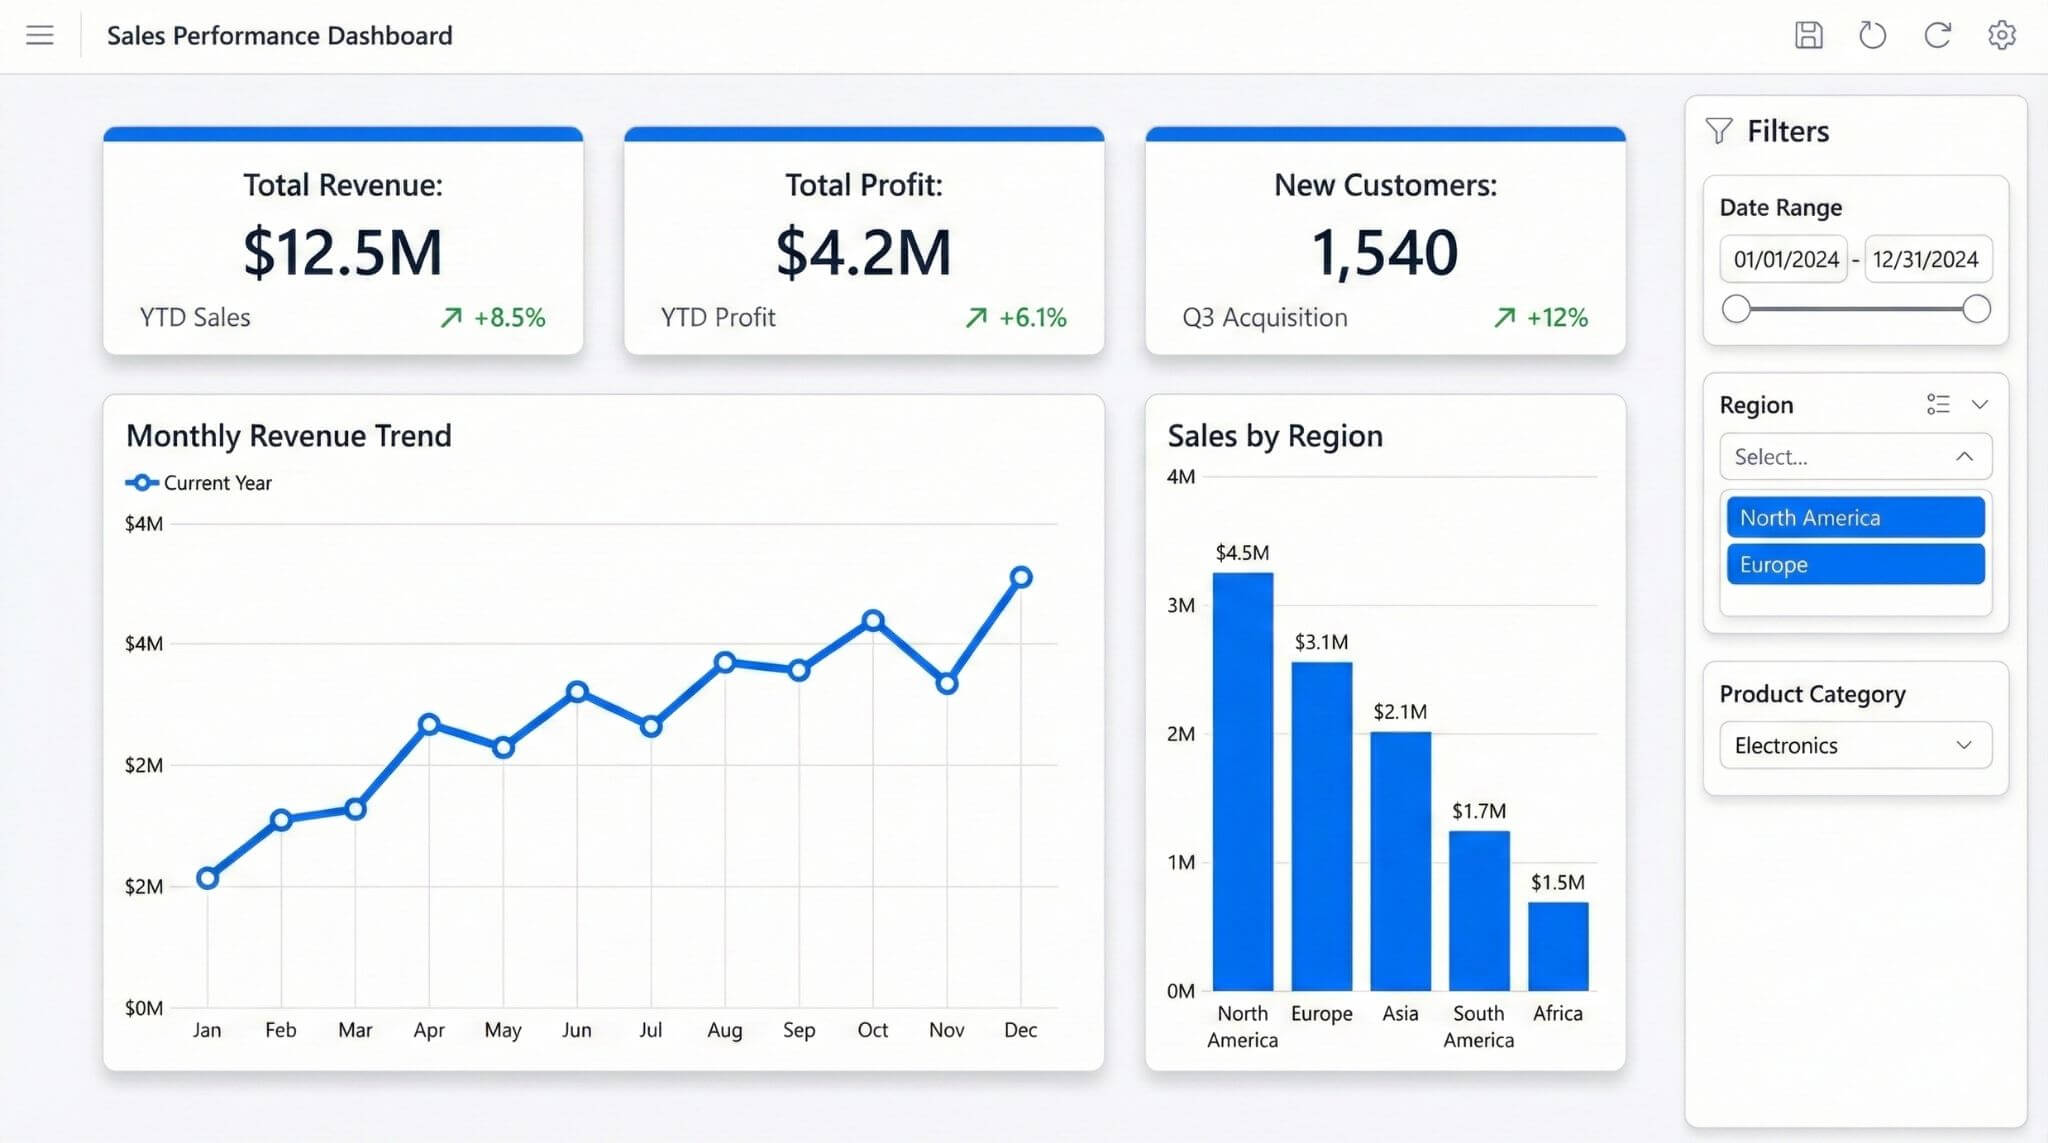
3) The 30-minute plan: what we’re building
This plan uses a standard layout that works well for beginner dashboards because it mirrors common stakeholder questions.
- 3 KPI tiles: Total Sales, Total Profit, Profit Margin
- 1 trend tile: Sales over time
- 1 breakdown tile: Sales by segment/region/product
- 1 filter: Year or Region (slicer on the report page)
4) Step 1: Import data (5 minutes)
Start with a small, clean dataset so you can focus on the Power BI workflow. For beginners, Excel or CSV is usually the fastest path.
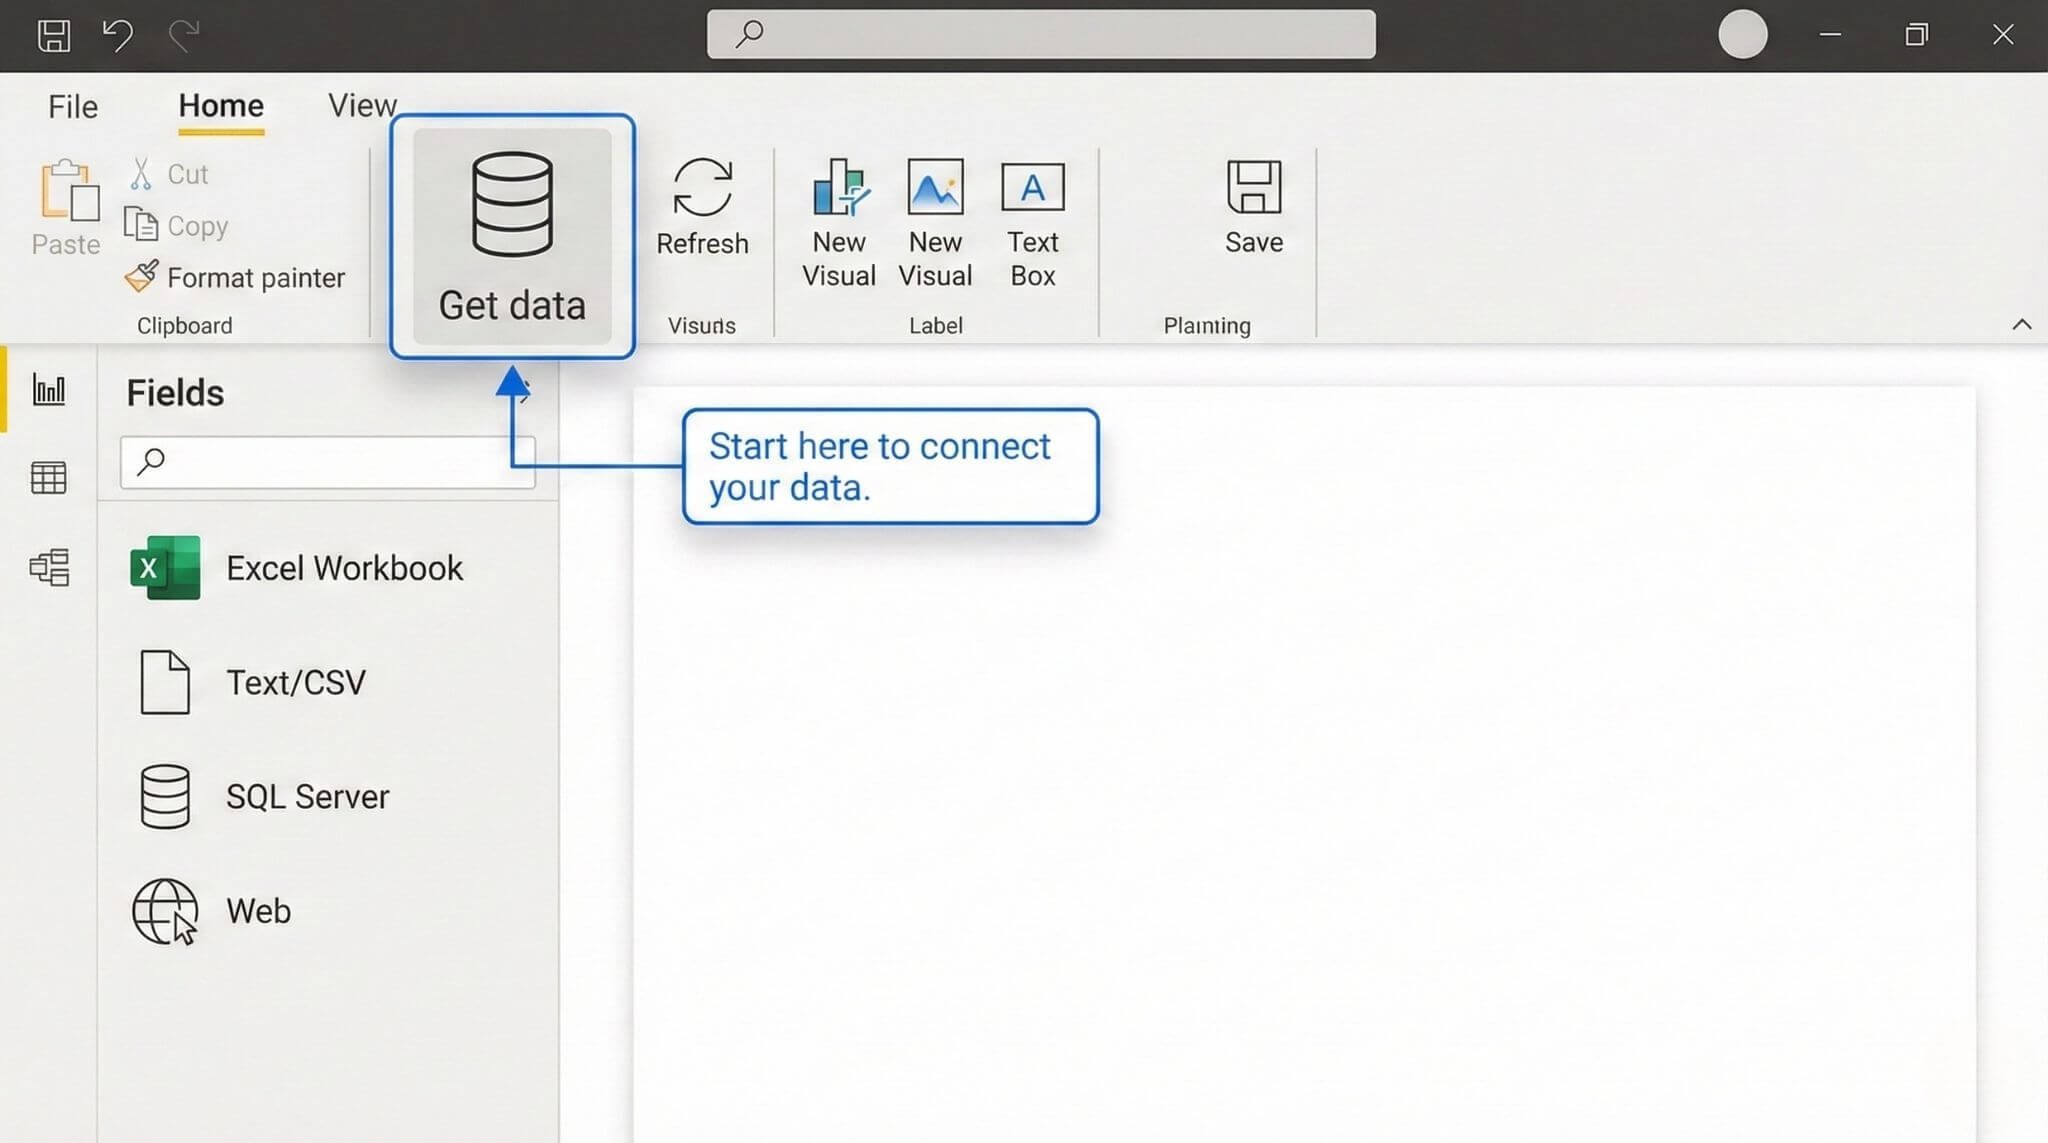
- Open Power BI Desktop.
- Select Home > Get data and choose Excel or Text/CSV.
- Select your file, then choose Load (or Transform Data to clean first).
5) Step 2: Clean & structure data (5–8 minutes)
Power Query is where you fix common data issues so your visuals behave properly. A small clean-up now prevents confusing results later.
- Confirm data types (dates, numbers, text).
- Rename columns to readable names.
- Trim/Clean text to prevent duplicate categories.
- Click Close & Apply.
Many “Power BI problems” are actually data problems (inconsistent labels, wrong data types, messy rows). Cleaning data makes measures, time trends, and filters behave predictably.
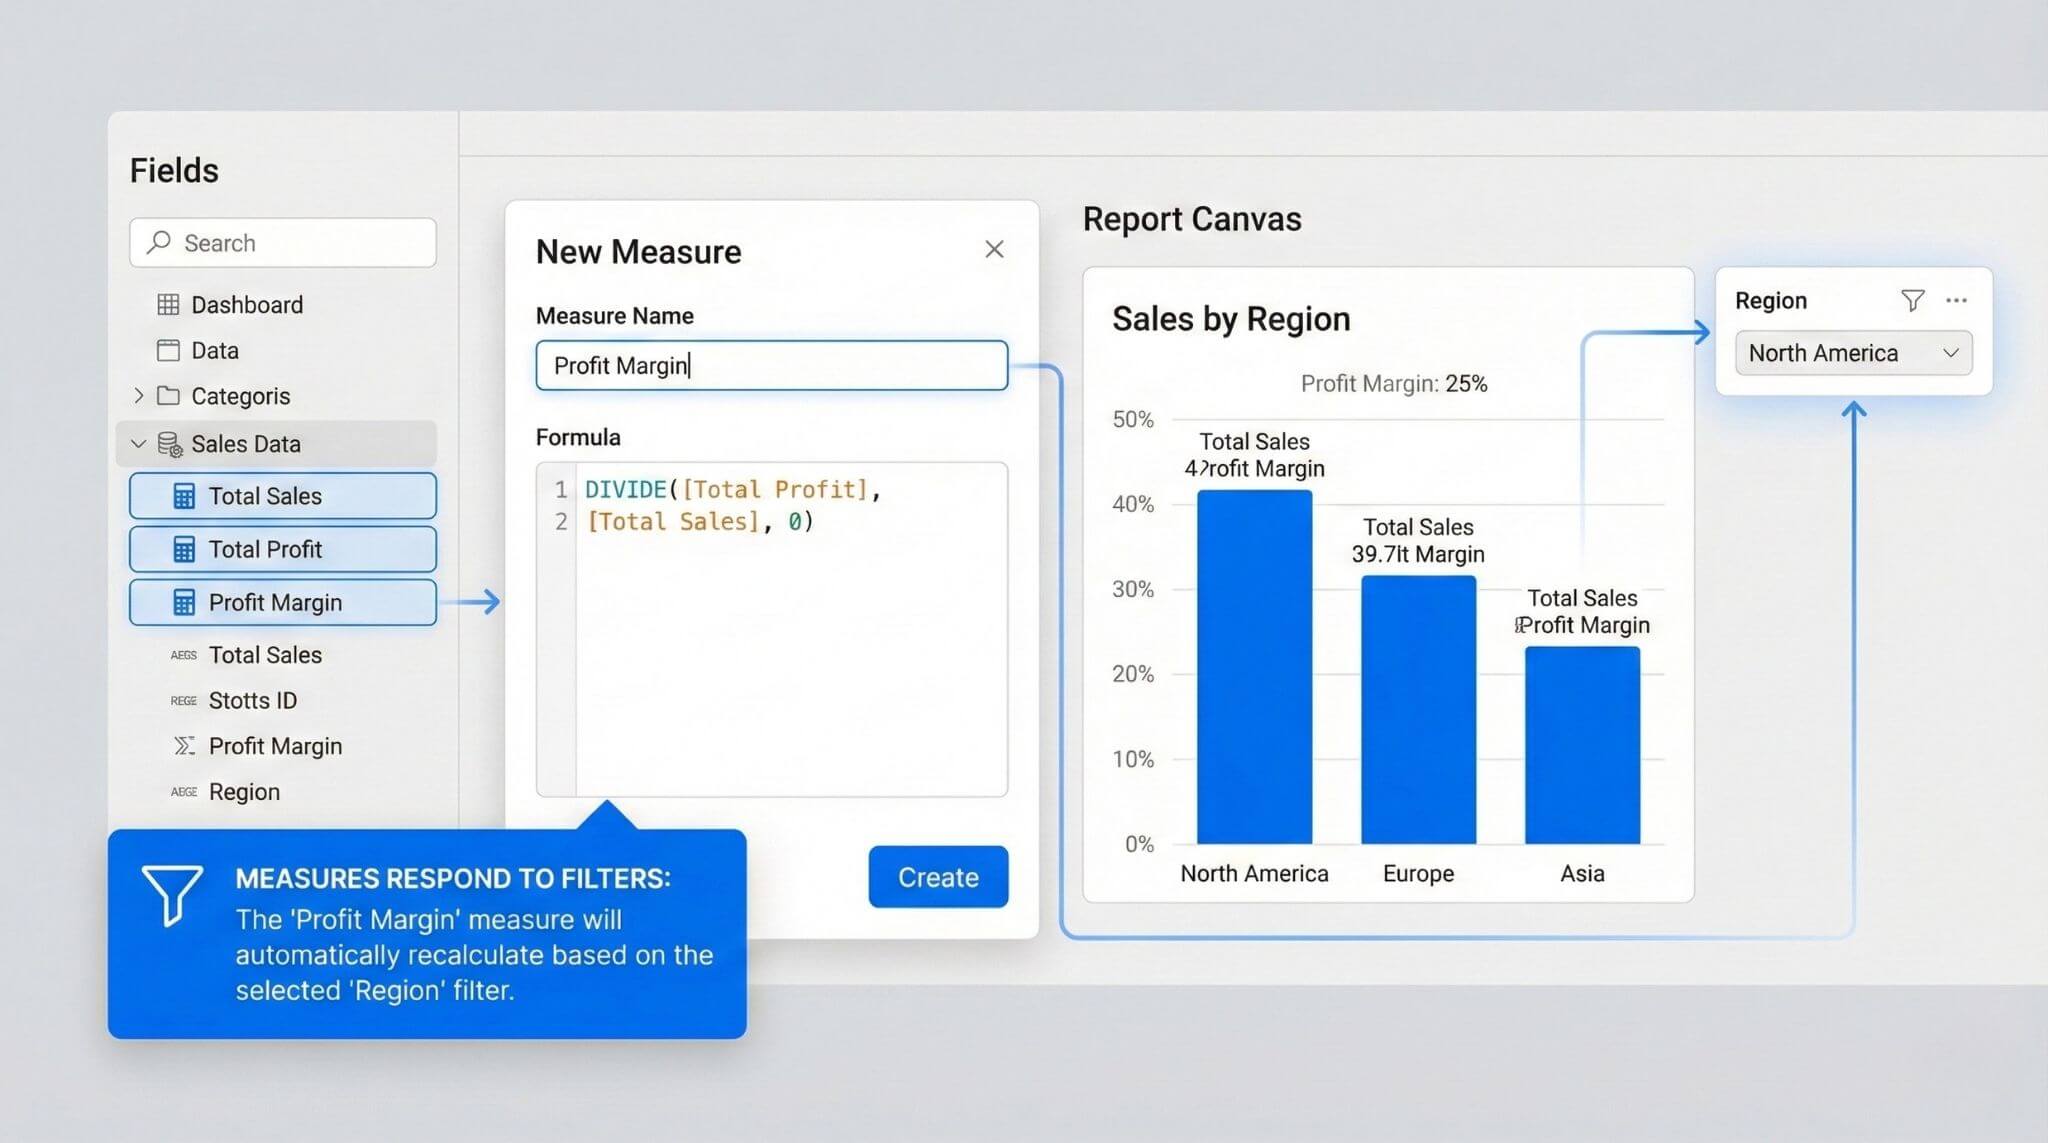
6) Step 3: Create measures (6–8 minutes)
Measures are reusable calculations that automatically respond to filters. For beginner dashboards, a small set of measures makes your KPIs consistent across every visual.
Go to Modeling > New measure, then create:
Tip: Using DIVIDE instead of simple division helps avoid errors when sales are zero or missing.
7) Step 4: Build the report visuals (6–8 minutes)
Your dashboard tiles will come from your report visuals, so build a clean “source” page first. Keep it simple and consistent.
- Card: Total Sales
- Card: Total Profit
- Card: Profit Margin
- Line chart: Date vs Total Sales
- Column chart: Segment/Region vs Total Sales
- Slicer: Year (or Region)
- Keep KPIs at the top in a single row.
- Place trend charts above breakdown charts.
- Use consistent titles and number formats.
- Avoid overcrowding (dashboards need whitespace).
- Insert a Line chart.
- Add your Date field to the axis.
- Add Total Sales (measure) to values.
- Set date granularity (Month is a common starting point).
- Apply consistent number formatting (currency, commas, decimals).
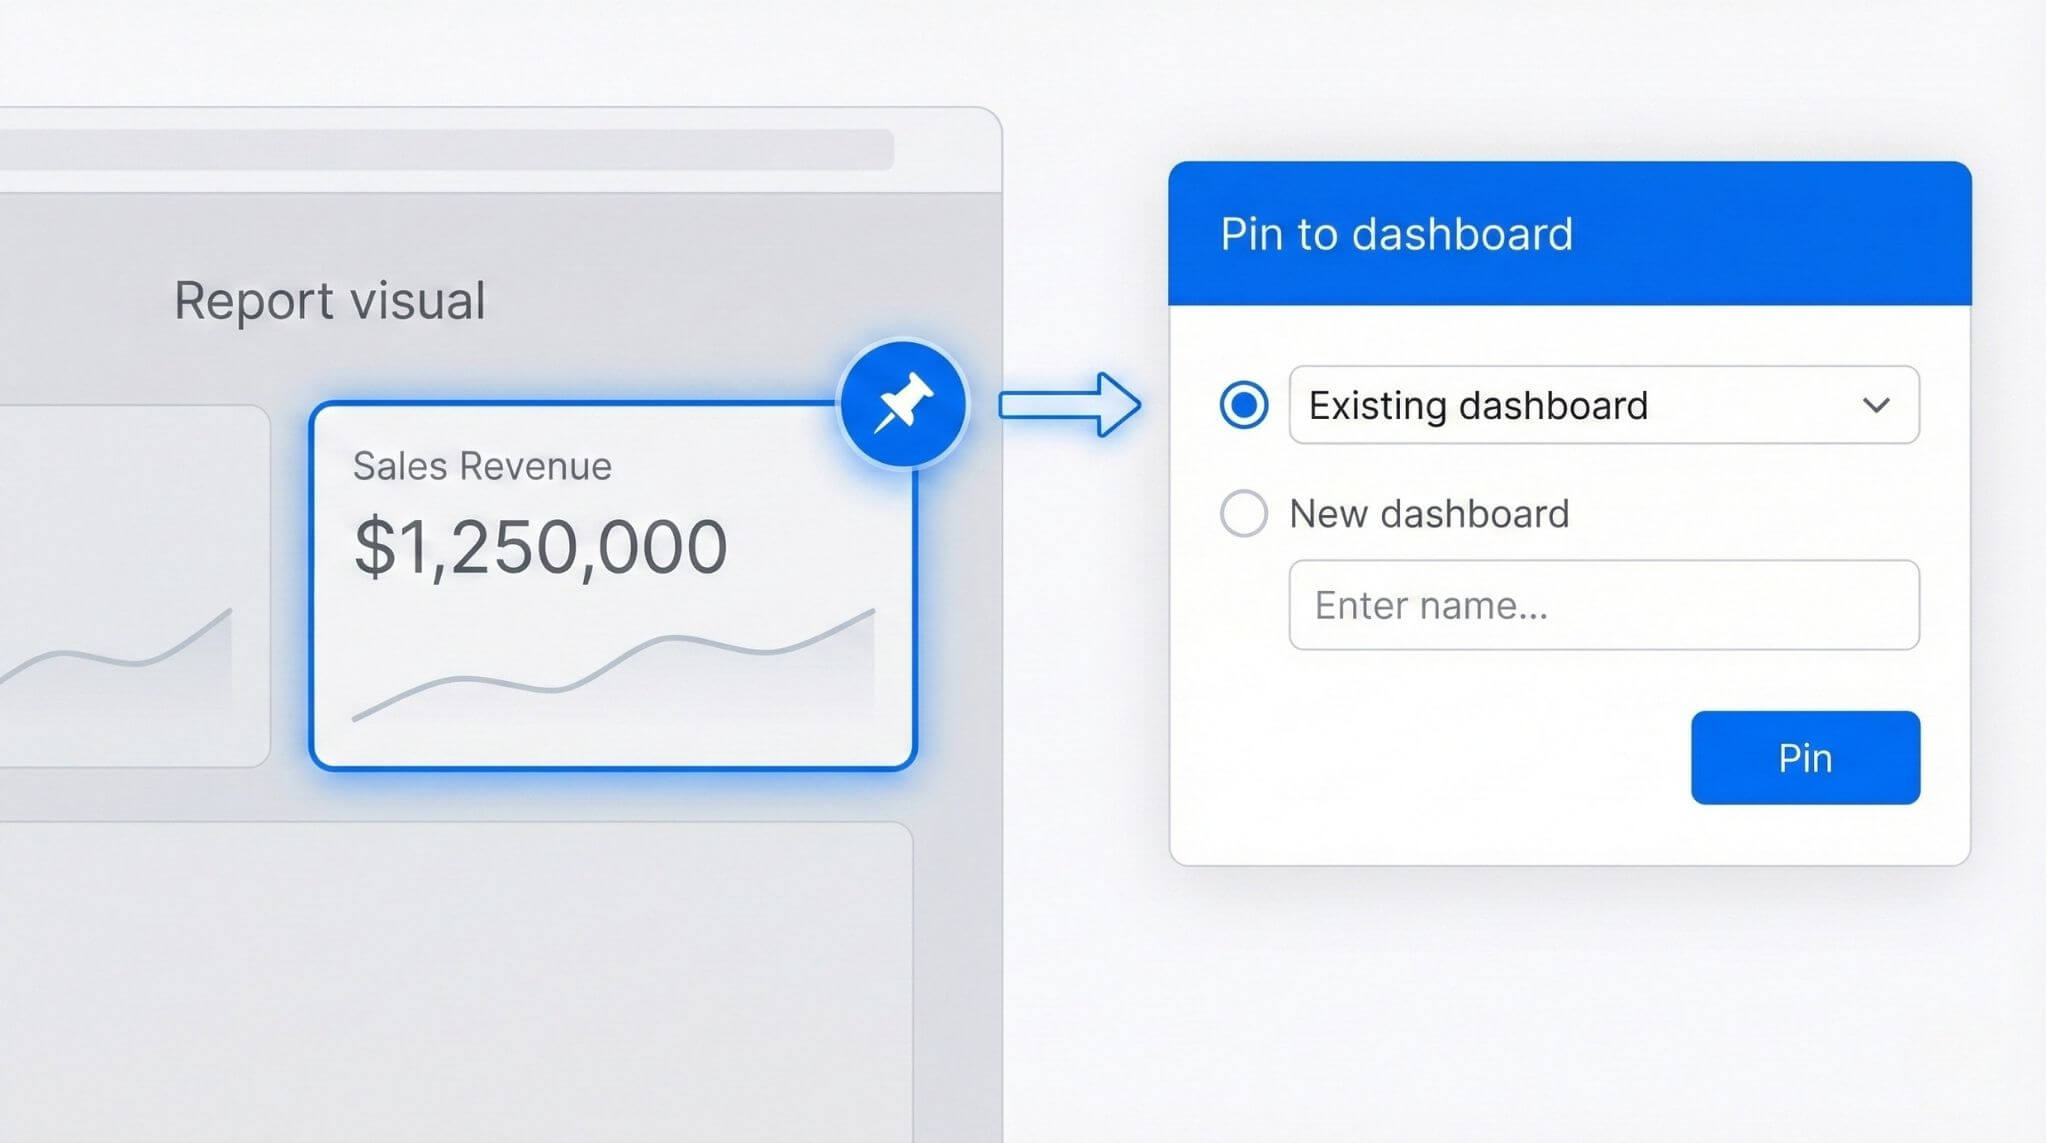
8) Step 5: Publish & pin to a dashboard (5–6 minutes)
This is where the dashboard is created. You publish the report to the service (web), then pin the most important visuals as dashboard tiles.
- In Desktop, click Home > Publish.
- Choose a workspace destination (often My workspace for first-time practice).
- Open the published report in the Power BI service.
- Hover a KPI visual and select Pin.
- Choose New dashboard, name it, then pin.
- Repeat for the remaining KPI cards and one or two charts.
- On the dashboard, arrange tiles into a simple grid layout.
- Open the report in the Power BI service.
- Hover a visual and choose Pin.
- Select your dashboard and confirm.
Best for KPI cards and key charts you want to monitor quickly.
Pinning a live page creates a live tile so users can interact with the page elements (including slicers) directly from the dashboard.
Best when you want the dashboard to behave more like the report, not just show a single standalone visual.
Refresh note: When the underlying dataset/report refreshes, the items on the dashboard refresh too. In other words, dashboards inherit the “freshness” of the report behind them — so a good refresh process is part of making dashboards trustworthy.
8.1) Create a mobile-friendly dashboard layout
Dashboards are often viewed on phones (especially by leaders who want a quick check-in). Power BI supports a mobile layout so your tiles aren’t squished into unreadable postage stamps.
- Open your dashboard in the Power BI service.
- Enter Edit mode.
- Switch to the dashboard mobile layout view.
- Drag and reorder tiles into a single-column, thumb-friendly layout.
- Save the dashboard.
Tip: Put the 3 KPI cards first, then the trend, then breakdown. Keep titles short so they stay readable on a phone.
Once you’ve built a first dashboard, the next step is making it reliable: consistent measures, clean data shaping, and sharing settings that match your organisation’s governance. Nexacu offers instructor-led Power BI Beginner training across Australia — in-person or remote — where you practise these foundations with realistic datasets and repeatable dashboard patterns.
9) Common mistakes (and how to avoid them)
- Expecting dashboards in Desktop: dashboards are built in the Power BI service by pinning tiles.
- Skipping data types: incorrect date/number types lead to odd charts and incorrect sorting.
- Too many tiles: dashboards should highlight decisions, not recreate the full report.
- Inconsistent definitions: agree on what “Sales” means (GST, refunds, timing) before sharing widely.
- Using columns instead of measures: measures make KPIs consistent across filters and slicers.
10) FAQs (expand to read)
These are common questions that come up when teams start building and sharing dashboards.
Why is a dashboard different from a report?
Reports are for analysis and explanation (multiple pages, filters, drill-down). Dashboards are for monitoring (single page, pinned highlights) and typically link back to the report for detail.
Why doesn’t my dashboard tile respond to slicers?
If you pinned a single visual, the tile won’t behave like a full report page with slicers and cross-filtering. If you need interaction inside the dashboard, pin a live page as a live tile.
Why aren’t my numbers changing when I filter?
Check that your visuals use measures (e.g. Total Sales) rather than relying on raw fields. Also confirm data types and that slicers are based on valid fields (dates recognised as dates, categories consistent).
Do dashboard tiles update when data refreshes?
Yes — when the underlying dataset/report refreshes, dashboard tiles update to reflect the latest data. If a dashboard looks “out of date”, the fix is usually checking the refresh process behind the report rather than rebuilding the dashboard.
What should I build after my first dashboard?
Build a dashboard that supports a real process with clear owners and actions (pipeline health, overdue jobs, SLA performance, budget vs actual). Dashboards work best when someone is responsible for responding to what they show.
11) Next steps: make dashboards easier to trust
Your first dashboard is the starting point. To make it “production-ready”, focus on consistency, governance, and repeatability so the numbers mean the same thing everywhere.
- Standardise measures: define core KPIs once, reuse everywhere.
- Build templates: reuse layout patterns for consistent reporting.
- Document definitions: add a short KPI note (“what’s included”).
- Plan refresh: decide data update frequency and ownership.
- Improve gradually: add drill-through, tooltips, and better modelling after the basics.
Learn Power BI fundamentals with practical workplace examples
Nexacu’s Power BI Beginner course covers data prep, modelling basics, core visuals, publishing, and sharing — with hands-on exercises designed for AU/NZ reporting scenarios.
- Power BI training courses
Instructor-led, beginner to advanced
- Power BI Beginner
Build reports and dashboards confidently
Note: Power BI menus and sharing options can vary by organisation. If you’re publishing to shared workspaces, confirm access and governance requirements with your admin.