In today’s data-driven world, professionals across industries rely on tools that help them organise, analyse, and visualise data. Microsoft Excel and Power BI are two of the most popular and powerful tools available. While Excel has long been a staple in workplaces, Power BI is emerging as the go-to platform for advanced data analytics and visualisation.
So, which tool is right for your needs? This article compares Power BI and Excel, highlighting their unique features, use cases, and advantages to help you make an informed decision. Whether you’re an individual looking to enhance your skills or an organisation seeking to improve decision-making, Nexacu offers comprehensive training for both platforms.
Excel: A Versatile Classic
Excel is a widely-used spreadsheet application that has stood the test of time. It’s ideal for:
-
- Data Entry and Organisation: Create and manage spreadsheets with ease.
-
- Calculations and Analysis: Use formulas, functions, and pivot tables for data analysis.
-
- Basic Visualisation: Generate charts and graphs to present data visually.
-
- Customisation: Automate tasks using macros and Visual Basic for Applications (VBA).
Key Features of Excel
-
- Formulas and Functions: Perform calculations with ease using a vast library of built-in functions.
-
- Pivot Tables: Summarise and analyse large datasets efficiently.
-
- Data Cleaning: Use tools like text-to-columns and conditional formatting to prepare data.
-
- Macros and VBA: Automate repetitive tasks for improved efficiency.
Explore our Excel training courses here.
Power BI: The Future of Data Analytics
Power BI is a powerful business intelligence tool designed for advanced analytics and data visualisation. It’s perfect for:
-
Data Integration: Combine data from multiple sources such as Excel, databases, and cloud services.
-
Interactive Visualisation: Create dynamic dashboards and reports with real-time data updates.
-
Advanced Analytics: Use AI-powered tools and Data Analysis Expressions (DAX) for in-depth insights.
-
Collaboration: Share reports seamlessly across teams and devices.
Key Features of Power BI
-
Data Modelling: Build relationships between datasets for advanced analysis.
-
Custom Visuals: Use built-in and third-party visuals to enhance your reports.
-
Real-Time Dashboards: Monitor key metrics and trends in real-time.
-
DAX Functions: Perform complex calculations and aggregations for deeper insights.
Discover our Power BI training courses here.
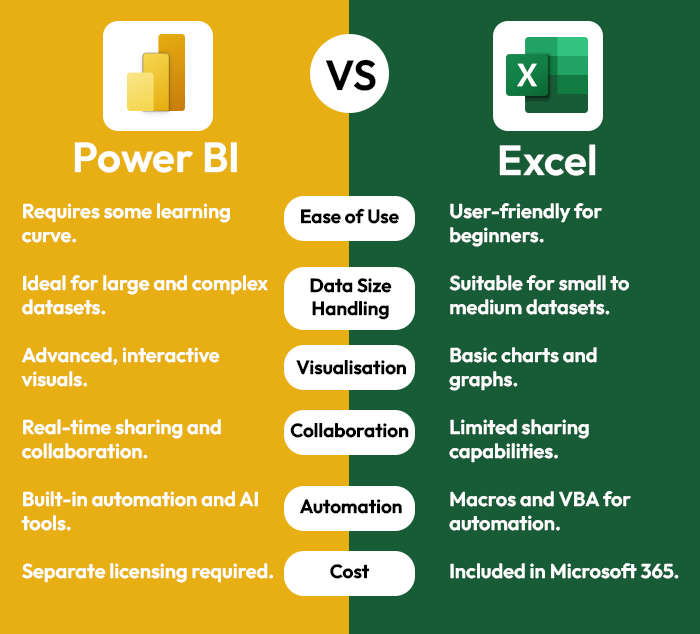
Excel vs Power BI: A Side-by-Side Comparison

Choosing the Right Tool for Your Needs
Use Excel If You:
-
Work with small to medium datasets.
-
Need a tool for basic data entry, analysis, and reporting.
-
Rely on formulas, pivot tables, and macros for daily tasks.
-
Prefer a familiar interface and minimal learning curve.
Use Power BI If You:
-
Work with large or complex datasets.
-
Require advanced data modelling and analytics.
-
Need to create dynamic, interactive dashboards.
-
Want seamless collaboration and sharing options.
Why Excel and Power BI Make the Perfect Pair?
For many professionals and organisations, Excel and Power BI complement each other. Excel is excellent for data preparation and preliminary analysis, while Power BI excels at advanced analytics and sharing insights with stakeholders. Together, they offer a comprehensive solution for end-to-end data management and analysis.
How Nexacu Can Help
At Nexacu, we offer expert-led training courses for both Excel and Power BI, ensuring you gain the skills to make the most of these powerful tools. Our courses cater to all experience levels, with options for individuals and corporate teams.
Flexible Learning Options:
-
In-Person Training: Hands-on learning at our training centres.
-
Online Training: Interactive sessions led by experienced instructors.
-
Corporate Training: Customised solutions to meet your team’s needs.
Explore all our training courses here.
Testimonials from Nexacu Learners
"The Power BI course at Nexacu was a game-changer for me. I can now create dashboards that provide actionable insights for my team." — Sarah, Marketing Analyst
"I’ve been using Excel for years, but Nexacu’s advanced course taught me how to automate my workflows and save hours each week." — James, Financial Analyst
Take the Next Step
Whether you’re looking to master Excel, Power BI, or both, Nexacu’s expert-led training courses provide the tools and knowledge to enhance your data skills. Don’t let data challenges hold you back—unlock your potential today.
Ready to get started? Book your course with Nexacu now!


