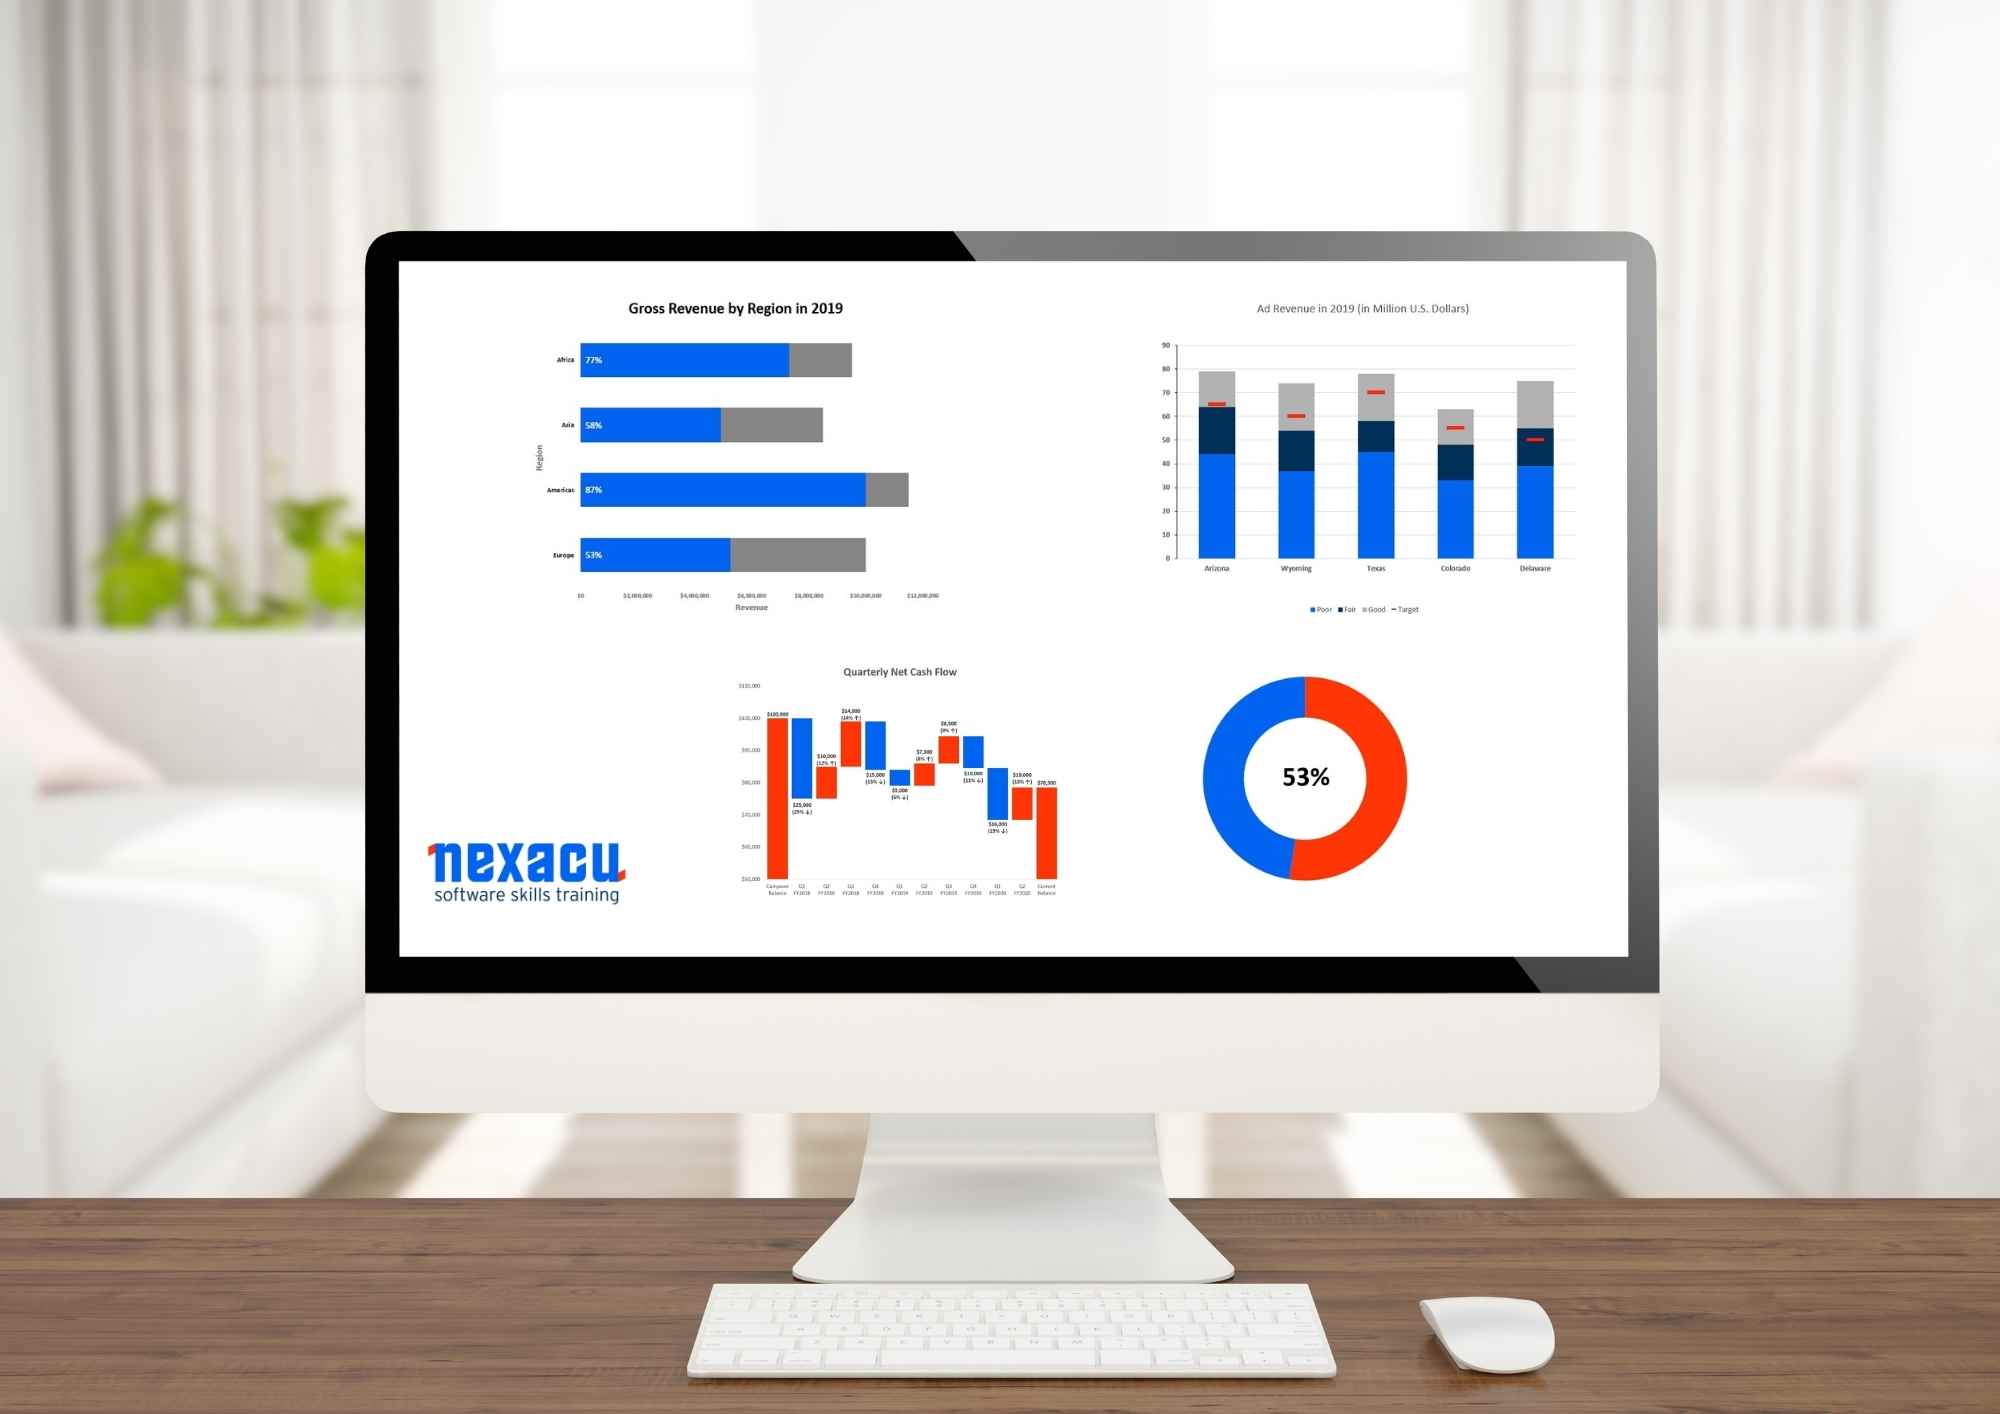
The business world is now more data-driven than ever. To achieve business goals, businesses must glean insights from data to direct business decisions. The process involves aggregating data, analysing it for insights, and communicating valuable information so it is easily understood and accepted. The main goal of a Data Visualisation Analyst is to communicate information effectively.
Thus, gleaning insight from data is not enough. The information must be effectively presented and communicated to facilitate understanding and acceptance. Data Visualisation Experts do this.
Though data visualisation is crucial to business success, it is not as well-known or developed as other data jobs in terms of being a career. Thus, not many people know how to be a Data Visualisation Analyst.
This article will tell you everything about how to become a Data Visualisation Analyst.
Specifically, we’ll cover:
- What is a Data Visualisation Analyst
- Roles and responsibilities of a Data Visualisation Analyst?
- Typical employers of a Data Visualisation Analyst
- Required skills and education of a Data Visualisation Analyst
- Salary of a Data Visualisation Analyst
- Steps to becoming a Data Visualisation Analyst
- Is data visualisation the right role for me?
- Types of data visualisation positions
- Personal attributes required
- Opportunities for advancement
- Alternative careers in data visualisation
What is Data Visualisation?
Data visualisation is the graphic representation of data to make large and complex data easy to understand. It is concerned with communicating information to make it easy to interpret and spot trends and patterns.
Data visualisation makes use of pictorial diagrams, such as:
- Graphs
- Charts
- Tables
- Maps
- Infographics
- Dashboards
A simple example of data visualisation is using bar charts or pie charts to represent hundreds of rows and columns of raw data in an Excel spreadsheet.
What is a Data Visualisation Analyst?
A Data Visualisation Analyst is someone who uses pictorial diagrams to represent data, making them easy to understand despite the complexity of the data.
As a Data Visualisation Analyst, your job is to take heaps of raw and complex data and reduce them to eye-catchy and easy-to-understand visual representations like:
- Bar charts
- Gantt charts
- Heat maps
- Scatter diagrams
- Cartogram
- Network diagrams
- Timelines

Roles and Responsibilities
Know that there aren’t many data visualisation jobs. Graphically and pictorially representing data is a skill that is needed as part of other jobs such as data analysis, financial analysis, business administration, etc.
However, a typical Data Visualisation Analyst job description includes:
- Data mining from different sources
- Creating dashboards/ reports for communicating information
- Making the presentation of data insights visually appealing
- Making complex datasets easy to understand
- Reducing large datasets into easy-to-read briefs/ summaries
- Making it easy to detect patterns and trends in data sets
- Showing how individual data elements relate to organisational processes
- Making business data more useable
Typical employers
Data Visualisation Analysts will find employment across a wide range of industries. Typical employers include:
- Banks
- Accounting and insurance companies
- IT and telecommunications companies
- Consulting firms
- Social media specialists
- Health care
- Research labs
- Public sector organisations
Required Education
Data visualisation is generally a component of other data jobs, and these always require a college degree.
The best degree for data visualisation analysis is in numerous subjects like maths, statistics, and computer science, but degrees in business, finance, and accounting often suffice.
When it comes to data analyst qualifications, the minimum requirement is a bachelor’s degree, but having a higher degree (like a master’s or an MBA) does better in the job hunt.
Key Skills
Data visualisation requires specific skill sets. These include:
- Attention to detail
- Ability to work with numbers
- Critical thinking skills
- Excellent verbal and written communication skills
- Excellent presentation skills
- Basic visual design skills
Salary
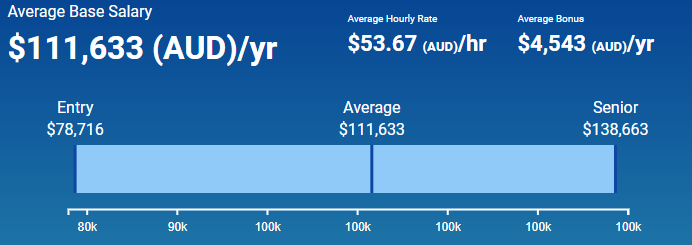
Data Visualisation Analysts have high earning potential. As of writing, the average salary of a Data Visualisation Analyst in Australia is $111,633.
However, depending on several factors (like the company, the industry, years of experience, etc.), salaries can range between $78,000 and $138,000.

Steps to Becoming a Data Visualisation Analyst
How to become a Data Visualisation Analyst is quite clear. The qualifying process is the same as those of other data jobs.
- Earn a bachelor’s degree
- Complete an internship and other activities
- Find a job
Step 1: Earn a Bachelor’s Degree
It is virtually impossible to get a data job without a bachelor’s degree in a numerate subject.
However, a bachelor’s degree is just the minimum qualification. Earning a higher degree is an excellent option for aspiring Data Visualisation Analysts. Higher degrees will teach you advanced visualisation skills and essential people management skills.
Earning a related certification is also an alternative to a master’s degree. Many employers prefer certifications because they reflect current standards better than higher degrees.
A “bachelor’s degree + a master’s degree + relevant certification” will swing the door wide open for you.
Step 2: Complete an Internship and other activities
Employers value candidates with experience over those with only paper qualifications.
An internship allows you to get valuable data visualisation experience. As an intern, you’ll apply your theoretical visualisation knowledge - you’ll mine data from different sources, evaluate it, and visually represent it for easy understanding. You’ll also learn to deal with the pressures of an actual working environment.
Besides completing an internship, you should also consider completing courses to master data visualisation technologies.
Know that expertise in data visualisation requires mastery of specific technologies. Sadly, a college education often does not grant such technological proficiency. For example, you must become versed in Excel, Tableau, R programming language, Python, etc.
Step 3: Find a Job
After getting the education, sharpening your skills, and completing an internship for hands-on experience, you can then proceed to find a data visualisation job.
When finding the right job, it is often advised to start with a small job and use that as a springboard to land bigger jobs. A small job helps you get or grow your relevant experience, making you a better candidate for big data visualisation roles.
Also, with data visualisation being a component of other data jobs, there are not many openings specifically mentioning the role. So, you may have to apply to other job titles to which data visualisation is crucial, such as Data Analyst, Data Scientist, etc.
Is Data Visualisation Analyst the right role for me?
Not everyone can be a Data Visualisation Analyst. This is because not everyone has the requisite qualification, skills, or attributes.
However, if you have these, Data Visualisation Analyst may be the right role right for you, but you must consider whether it is the right fit for your personality. For example: if you major in statistics or computer science, enjoy working with numbers, and enjoy simplifying information with visual representations, then being a Data Visualisation Analyst may be your calling.
Type of Data Visualisation Positions
When a data visualisation job is available, it is usually in one of four positions.
- Data Visualisation Specialist. The position requires building data analysis tools (like dashboards) to represent complex datasets. It also requires researching and testing machine-learning algorithms to find the best options.
- Data Visualisation Analyst. The position involves mining data from different sources, evaluating them, and usually representing insights to facilitate understanding.
- Data Visualisation Engineer. This position requires establishing data visualisation standards for the best user experience. It also involves testing the data analytics platform, finding bugs, and fixing them.
- Data Visualisation Developer. This position is often titled “Business Intelligence Analyst.” It focuses on business reporting. It requires creating visualisation tools to show business opportunities. It also requires designing training programs to align relevant stakeholders (including management and departmental teams).
Personal Attributes Required
Succeeding as a Data Visualisation Analyst requires having specific personal attributes. These include:
- Having patience
- Paying attention to details
- Being inquisitive
- Being creative
- Having an open mind
- Having critical thinking skills
Opportunities for Advancement
In virtually all professions, the growth path takes you from a junior role into a senior role. It is the same with a Data Visualisation Analyst career path.
However, because data visualisation is generally regarded as a component of other data jobs, people are often required to build and use other data-related skills. For example, you may need to analyse a dataset before building visualisation tools to represent and communicate the information.
As such, most often than not, the growth path that many explore in data visualisation is branching into these other data-related jobs. That is, you have people starting in data visualisation and becoming seasoned:
- Data Analysts
- Data Scientists
- Business Intelligence Analysts
- Business Systems Analysts
- Marketing Specialists
Alternative Careers
The more data-driven businesses become, the more expansive data jobs become. These data jobs are the best alternative careers for Data Visualisation Analysts. This is because you can move to these jobs with the same qualifications (degree and skillset) as a Data Visualisation Analyst.
These data jobs that are excellent alternatives for Data Visualisation Analysts include:
- Data Analyst
- Data Scientist
- Data Engineer
- Data Architect
- Database Administrator
- Statistician
- Business Intelligence Analyst
- Business Systems Analyst
- Machine Learning Engineer
- Machine Learning Scientist
For more information about our range of software skills training courses or specific data visualisation training like Power BI for beginners, intermediate or advanced, visit our website or social media.


