
How to make a Bar Graph in R
When comparing data sets, bar graphs can be a great analysis tool to utilise. In this article, we will dive into exactly how to get started making bar graphs in R.
When comparing data sets, bar graphs can be a great analysis tool to utilise. In this article, we will dive into exactly how to get started making bar graphs in R.

Data Analytics is one of the most promising fields for job growth. Businesses worldwide will need to continue to increase their analytical capabilities to develop a competitive edge.

Excel is known to be one of the most commonly used data software. In this article, we take a closer look at what makes it just so effective for data analysis, and how to get started.

Big data provides actionable results and insights that have made it a crucial component of today's tech world. To sort through such massive datasets and retrieve the right information, you must have the right tools and understand how to use them.

Big data is playing a greater role in almost every industry. On the back of our increasing reliance on data to make decisions, many new types of roles are emerging, including that of a Data Visualisation Analyst.


A perusal of any article about data will lead to the conclusion that in the internet age, data is pretty much everything. See why SQL is so valuable.
One of our recent discoveries is BERT aka the Basic Excel R Toolkit. This is a package for working with the R programming language functions from Excel. It's a wonderful resource for adding functionality to Excel and best of all, it is free!

The R package, janitor, contains easy-to-use and convenient functions for basic data cleaning jobs and examining data. Let's take a look at some of these functions.

Structured Query Language (SQL) is currently one of most desirable and transferable skills in organisations across industries. But what is SQL? and why should you start learning it?

The data frame (or DataFrame) is an essential tool for anyone using R or Python to analyse data. They are rectangular or tabular data structures, that hold rows and columns of data, similar to tables in a database or an Excel spreadsheet.
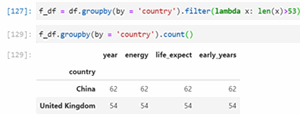
The pandas groupby() is a versatile DataFrame method that enables to users to quickly and efficiently separate datasets into groups by a chosen variable. It can be used to report summary statistics for each group, loop over groups and to separate data into subsets.
We have recently been training a growing number of professionals in R and Python as they migrate from other code-based analytical packages such as MATLAB, Stata, SAS and SPSS. This post outlines some of the reasons for using code-based tools and why organisations are increasingly using Python and R for their data analysis needs.

The apply family of functions in R allow you to apply a function repeatedly to subsets of data in a single line of short code. Apply functions automatically to each column or row of data. Alternatively, apply functions to subsets of a data based on a category variable.

Both R and Python have a huge range of functionality available for working with data. Investing a few weeks to learn to use a programming language will enable you achieve big productivity gains.


 phone
phone
 email
email
 enquiry