
Managing Alerts and Subscriptions on Power BI
Power BI Video Series | Episode 7
Learn how to set up and manage alerts and subscriptions on Power BI in this short tutorial video by Microsoft Certified Trainer, Steven Knight.

Power BI Video Series | Episode 7
Learn how to set up and manage alerts and subscriptions on Power BI in this short tutorial video by Microsoft Certified Trainer, Steven Knight.

Power BI Video Series | Episode 6
Learn about the different options available when exporting from Power BI in this short tutorial video by Microsoft Certified Trainer, Steven Knight.

Power BI Video Series | Episode 5
Learn how to use the Power BI bookmarks feature in this short tutorial video by Microsoft Certified Trainer, Steven Knight.

Power BI Video Series | Episode 4
Learn how to use filters, slicers and interact with visualisations in Power BI in this short tutorial video by Microsoft Certified Trainer, Steven Knight.

Power BI Video Series | Episode 3
A quick video guide covering how to best navigate Power BI reports and dashboards from experienced Microsoft Certified Trainer, Steven Knight.

Power BI Video Series | Episode 2
Learn how to access Power BI Apps published by your organisation in this short tutorial video by Microsoft Certified Trainer, Steven Knight.


With the recent focus in the budget on training, reskilling and digital transformation now is a great time to remind you of end user applications that feed into that narrative. Written in both technical and layman's terms...

Microsoft has recently embedded Power Platform capabilities in Microsoft Teams, meaning customers can now make personal apps, chat bots and more using low-code tools at no additional cost.

Is this your own project or part of a team? Are there many deliverables or very few? These are critical factors in determining the right task management software.
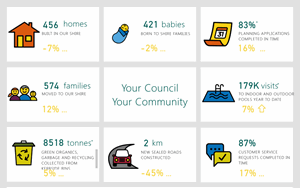
Local Government puts Power BI into action and the results speak for themselves.
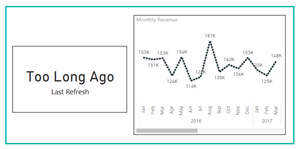
In Power Bi, you can easily connect to your data, perform cleansing and modelling, and develop meaningful visuals. However a challenging concept is that of refreshing the data.
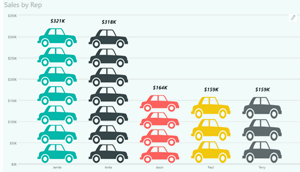
One of the best ways to communicate your data effectively is to create a story with your data. You can create a number of effective visualisations for your data by using infographics in Power BI. Make it fun, get your readers attention!

Following on from Tuesday's post we come with the second post of our Power BI Seamless Integration series. Last week we delved into Apps that provide information to Power BI and this week we will be delving into Apps that integrate directly with Power BI and how to deal with Administration.
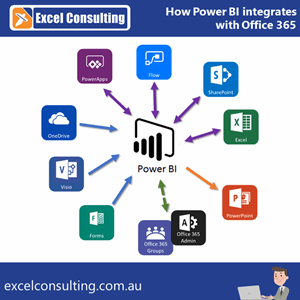
For our next series on Power BI our trainer Matt has put together a comprehensive guide on seamless Power BI Integration with Office 365. So, this follows along from last weeks series on Power BI Dashboard creation. For example, using Power BI integrations with Office 365 you will be able to create more powerful data driven dashboards.

Last week we created an interactive Power BI dashboard. As a result, we were able to use it to showcase our upcoming courses. Allowing anyone to filter the results based upon courses, locations and dates. We have received lots of questions about how we created the dashboard and this article will describe some key elements of the dashboard and how we created them.
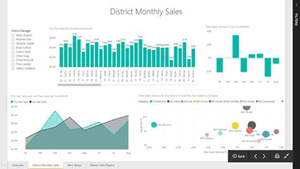
Discover Nexacu trainer Matt's top software pick for May - Microsoft Power BI. Why end-users need to Learn Power BI.

Business Intelligence (BI) is a concept that involves the delivery and integration of relevant and useful business information in an organisation. Here are some of the main reasons for investing in a good BI strategy and system.

According to the Microsoft Power BI website there are two major themes for the Power BI February update.

Everything that you need to know to get started with Microsoft’s data visualisation toolset, Power BI.
at Nexacu, we're proud to be the trusted training partner for hundreds of leading organisations accross Australia and New Zealand. From government departments to top corporates, we help teams upskill and succeed everyday


Students
4 & 5 Star Reviews
Google Reviews
Businesses Trust Nexacu
![]()
Custom workbook included with a step by step exercises


Learn with expert instructors, wherever you are


